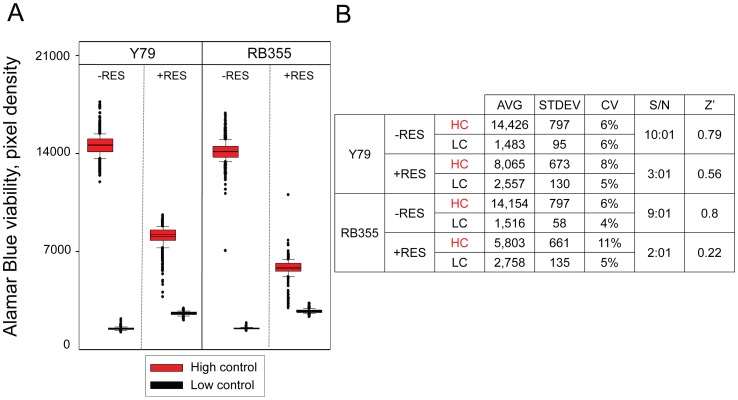
Figure 2. Control run experiment to evaluate the robustness of the optimized assay in the conditions of screening. A).
Box plot analysis of high control and low control data toward Y79 and RB355 cells in absence (-RES) and presence (+RES) of 80 µM resveratrol. Controls consisted of 1% DMSO (v/v) (high control) and 1 µM ‘killer mix’ in 1% DMSO (v/v) (low control) as final concentration. B) Summary table of statistics for the assay control run. The average pixel density (AVG), standard deviation (STDEV), coefficient of variation (CV), signal-to-noise ratio (S/N) and calculated Z’ values are presented.

