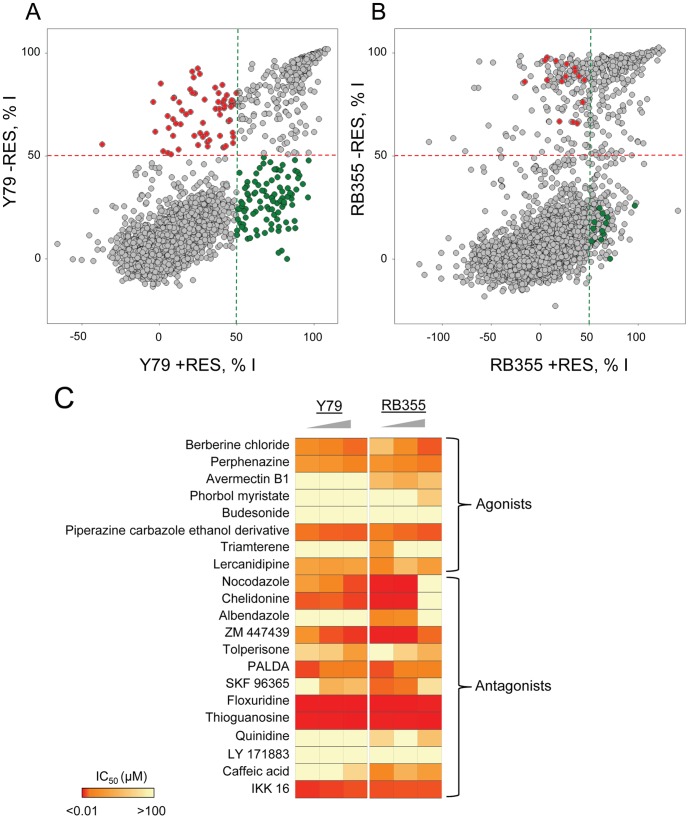
Figure 4. Selection and confirmation of positives. A).
Scatter plot analysis of the average percentage inhibition (%I) of each compound toward Y79 cells, in absence of resveratrol (−RES) or with 80 µM resveratrol co-treatment (+RES). Initial positives with agonistic activity are selected as those compounds inducing greater than or equal to 50% inhibition in presence of resveratrol and inducing less than or equal to 50% inhibition in absence of resveratrol (green). Initial positives with antagonistic activity are selected as those compounds inducing less than or equal to 50% inhibition in presence of resveratrol and inducing greater than or equal to 50% inhibition in absence of resveratrol (red). B) Scatter plot analysis of the average percentage inhibition (%I) of each compound toward RB355 cells, in absence of resveratrol (−RES) or with 80 µM resveratrol co-treatment (+RES). Positives from the Y79 screen with agonistic activity in both screens are selected as those compounds inducing greater than or equal to 50% inhibition in presence of resveratrol and inducing less than or equal to 50% inhibition in absence of resveratrol (green). Positives from the Y79 screen with antagonistic activity in both screens are selected as those compounds inducing less than or equal to 50% inhibition in presence of resveratrol and inducing greater than or equal to 50% inhibition in absence of resveratrol (red). C) Heatmap representation of the IC50 values of the selected 21 positives (8 agonists and 13 antagonists) toward Y79 and RB355 cells in absence of resveratrol or with 30 or 80 µM resveratrol co-treatment. The triangle symbolizes the increasing concentration in resveratrol.

