
Figure 4. The computational model of the complex superimposed on the B and C chains of the X-ray crystal structure (BCxray).
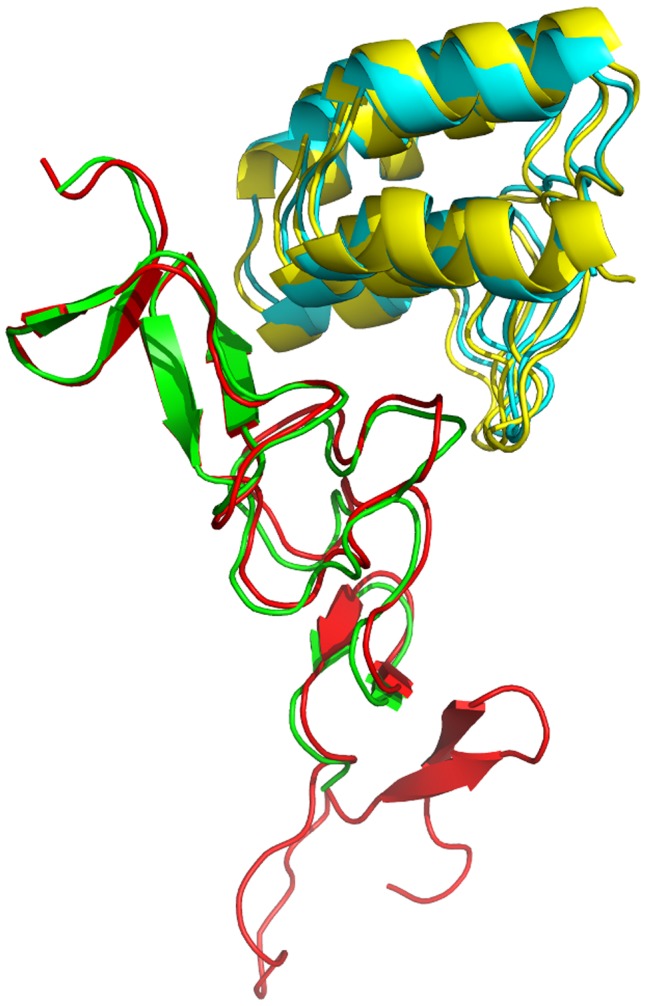
The G3 chains of the model and BCxray are in yellow and cyan, respectively, while the HER2 chains of the model and BCxray are shown in red and green, respectively.