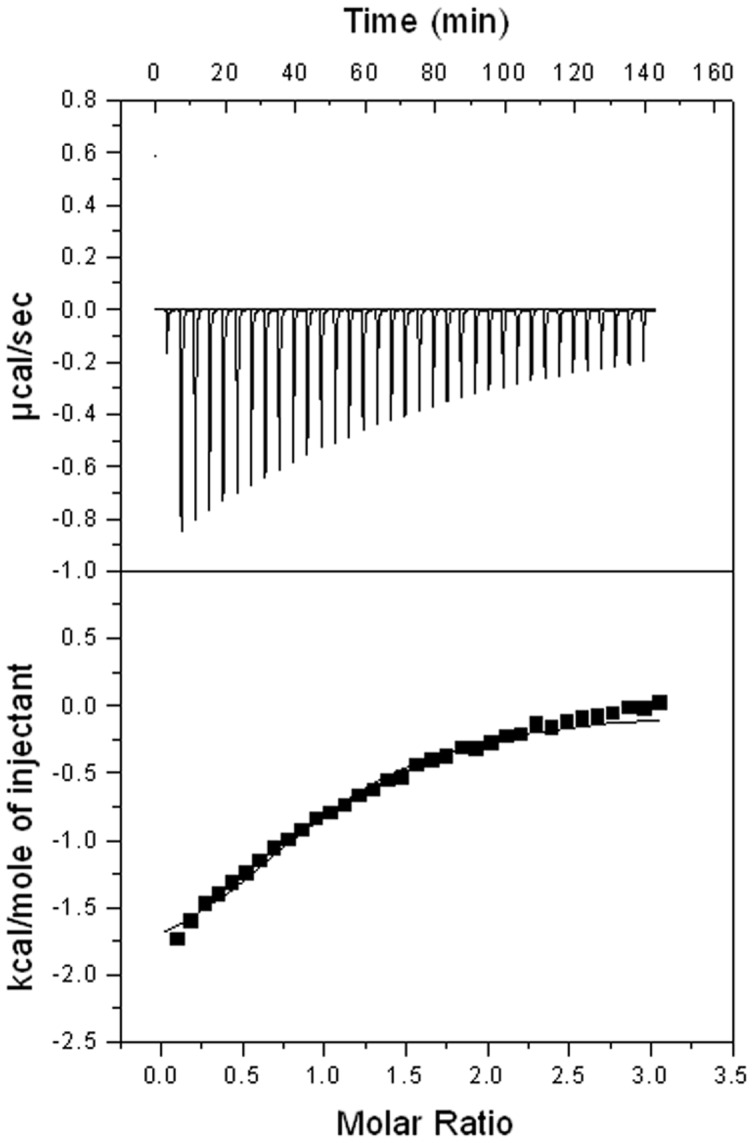
Figure 3. ITC analysis of the interaction of HasBCTD with the 21-mer peptide corresponding to HasR TonB box.

A representative experiment is shown. The heat signal (top) is presented together with the binding isotherm derived from the signal (bottom). The concentration of HasBCTD and the peptide were respectively, 9×10⁻⁵ M and 1.5 mM.
