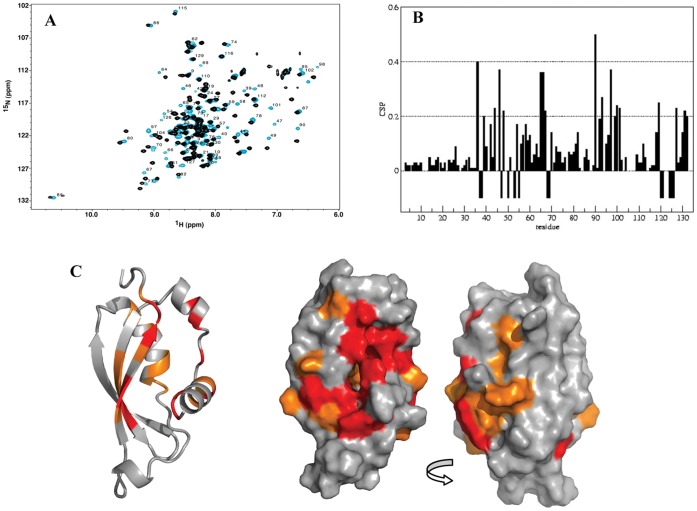
Figure 4. Analysis of HasBCTD upon HasR TonB box peptide binding.
A: 15N HSQC spectra of HasBCTD in the presence (blue) or absence (black) of the TonB box peptide. B: CSP values shown by residue; C: CSP mapped onto HasBCTD structure. Residues showing the greatest backbone amide shifts (>0.2 ppm) are shown in orange. Residues not seen in the 15N HSQC spectrum, due to intermediate chemical exchange, are indicated by negative bars in B and colored in red in C.

