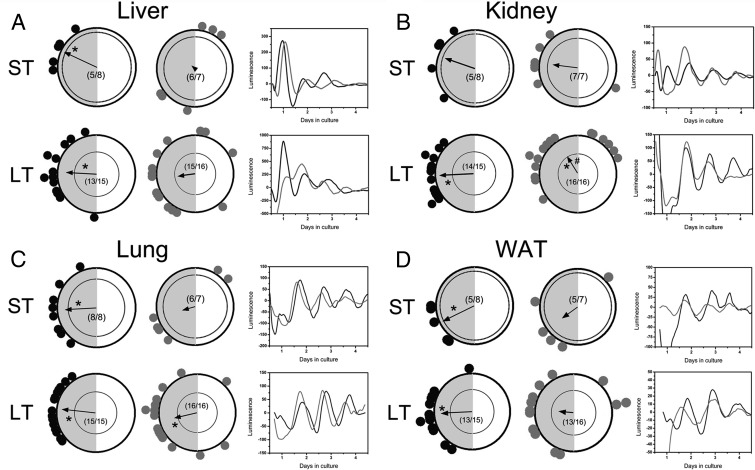
Figure 2.
ST or LT DHT exposure differentially affects phase distribution of peripheral clocks in the metabolic axis. (A) (left side) Rayleigh plots of peak per1-luc expression in liver explants from animals given (black dots) placebo pellets or (gray dots) DHT pellets. In each plot, the peak phase of per1 expression in a single explant is indicated by a separate dot. The gray shaded area on the left indicates the 12-hour dark phase. The vector in each circle represents the arithmetic mean phase for that group, and the inner circle represents a statistical threshold (P < .01) for phase distribution. Vectors that cross the inner circle indicate a tight distribution (also indicated as asterisks within the circle). The number of rhythmic cultures/total cultures prepared is located in the center of the plot. Boxes on the right show representative luminescence time series of per1-luc expression in tissues from control (black trace) and DHT-treated (gray trace) animals. (B) Rayleigh plots of peak per1-luc expression in kidney explants from animals given (black dots) placebo pellets or (gray dots) DHT pellets. (C) Rayleigh plots of peak per1-luc expression in lung explants from animals given (black dots) placebo pellets or (gray dots) DHT pellets. (D) Rayleigh plots of peak per1-luc expression in WAT explants from animals given (black dots) placebo pellets or (gray dots) DHT pellets. (B–D) Conventions are the same as in A. The # in panel B indicates significant (P < .05) difference in arithmetic mean phase between LT placebo- and LT DHT-treated cultures. ST exposure, 4–6 weeks; LT exposure, 9–15 weeks.

