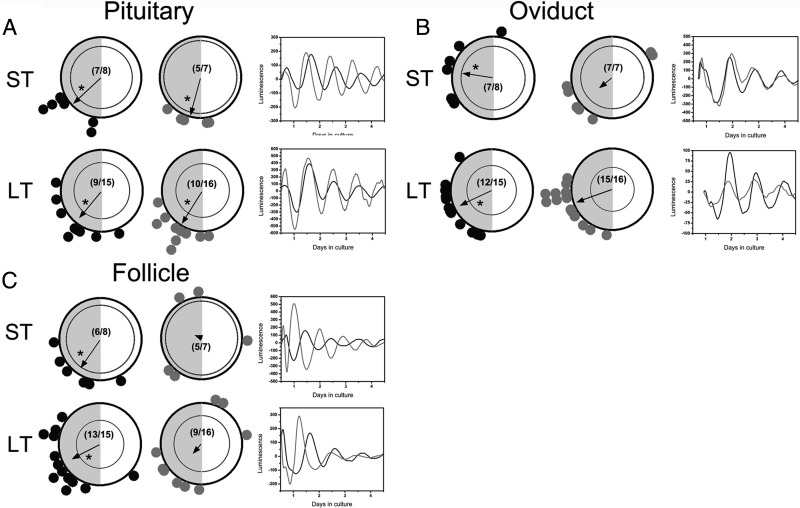
Figure 3.
ST or LT DHT exposure differentially affects phase distribution of peripheral clocks in the reproductive tract. (A) (left side) Rayleigh plots of peak per1-luc expression in pituitary explants from animals given (black dots) placebo pellets or (gray dots) DHT pellets. (Right side) Representative luminescence time series of per1-luc expression in pituitary explants from control (black trace) and DHT-treated (gray trace) animals. (B) (left side) Rayleigh plots of peak per1-luc expression in oviduct explants from animals given (black dots) placebo pellets or (gray dots) DHT pellets. Boxes on the right show representative luminescence time series of per1-luc expression in oviduct explants from control (black trace) and DHT-treated (gray trace) animals. (C) Rayleigh plots of peak per1-luc expression in single ovarian follicle explants from animals given (black dots) placebo pellets or (gray dots) DHT pellets. (Right side) Representative luminescence time series of per1-luc expression in tissues from control (black trace) and DHT-treated (gray trace) animals. (Right side) Representative luminescence time series of per1-luc expression in follicle cultures from control (black trace) and DHT-treated (gray trace) animals. All other details as in Figure 2.

