Figure 5.
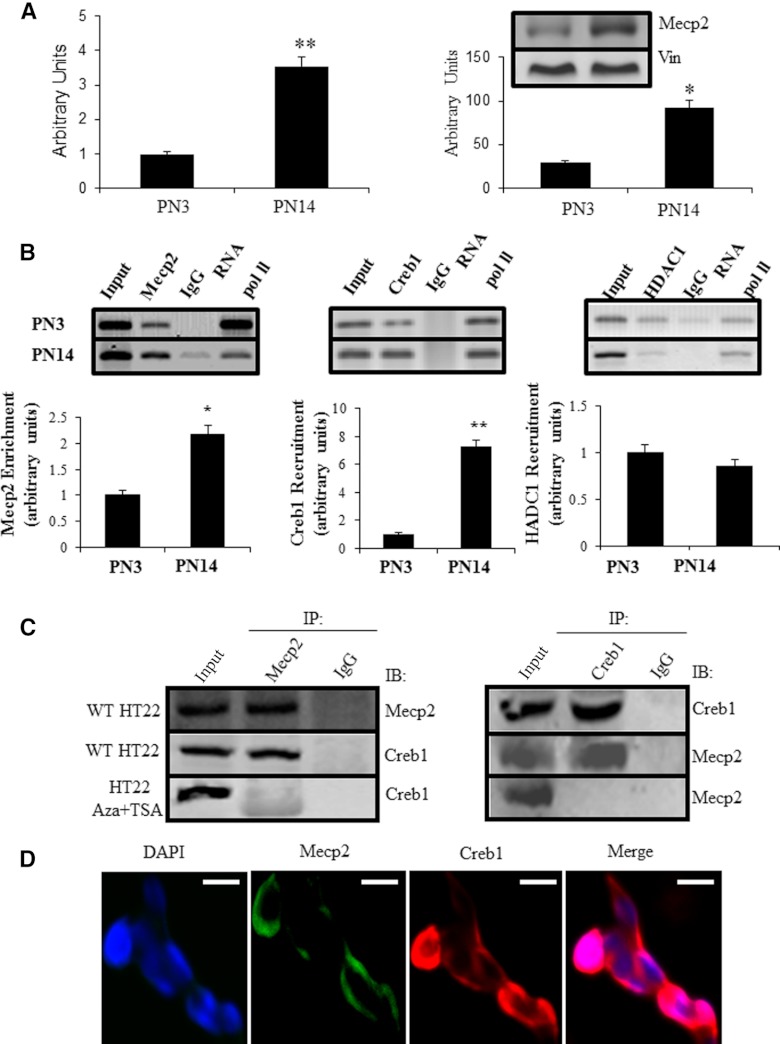
Glut3 expression was up-regulated upon enrichment of Mecp2 and Creb1 at the glut3 DNA fragment containing the CpG island in mouse postnatal neurons. (A and B) Mecp2 expression in mouse neurons at the mRNA level (A) and protein level with vinculin (Vin) serving as the internal control (B). (C) Co-IP experiments. ChIP assay targeting Mecp2 enrichment at the CpG island of the glut3 gene (left); and SeqChIP assay targeting Creb1 (middle) or HDAC1 (right) recruitment by Mecp2. IgG served as the negative control and RNA Pol II as the positive control. Representative blots are shown above. Protein enrichment/recruitment was expressed as a ratio of IP-DNA/input (target) to IP-DNA/input (RNA PoI II) followed by normalization to the PN3 value (depicted as 1). Data are shown as the mean ± SEM of 3 independent experiments shown below; *P < .05 and **P < .01 when compared with the PN3 value. Nuclei extracted from HT22 cells were IP with antibodies against Mecp2 and subsequently Western blotted with antibodies targeting Creb1 (left). Conversely, they were IP by antibodies against Creb1 and blotted by antibodies targeting Mecp2 (right), IPs performed with rabbit IgG were incorporated into each experiment as nonspecific negative control. Bottom panels show the Co-IP of nuclei obtained from HT22 cells treated with Aza-dC in combination with TSA. (D) Immunocolocalization of Mecp2 with Creb1 in HT22 cells. Cells were prepared, fixed, immunostained, and visualized by microscopy. To detect Mecp2, cells were incubated with goat antimouse Mecp2 antibody and stained with the FITC-conjugated antigoat IgG (green fluorescence), whereas Creb1 was detected by incubating with rabbit antimouse Creb1 antibody and immunostained using Texas red-conjugated antirabbit IgG (red fluorescence), nuclei were stained with 4′,6-diamino-2-phenylindole dihydrochloride (DAPI) (blue). Merged images showed superimposition of Mecp2 and Creb1 in right panel. Images are representative of at least 3 separate experiments yielding similar results. IB, immunoblotted. Scale bars, 10 μm.

