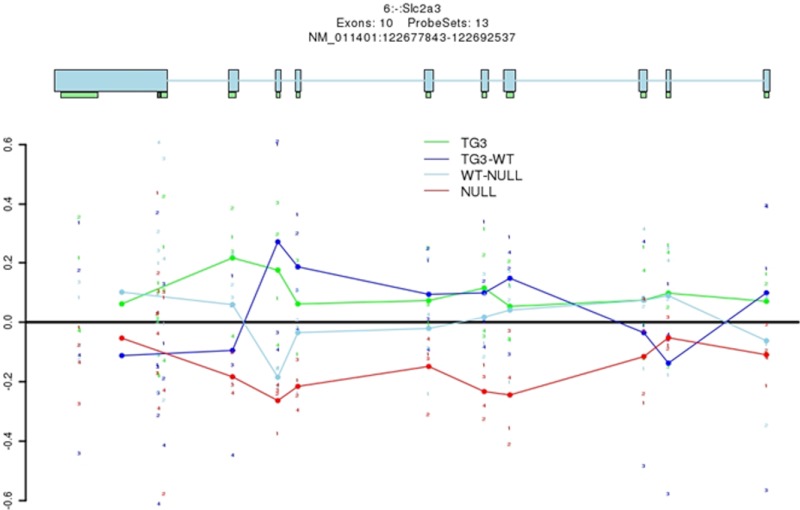
Figure 8.
Computer analysis of expression arrays revealed glut3 expression in MeCP2 null and transgenic mouse brains and their respective wild-type counterparts. Brain glut3 expression was reduced in Mecp2 null brain (NULL, red) vs wild-type (WT-NULL, light blue) brains (exons 2 to 8 and 10); however, no reciprocal increase in glut3 expression to the same extent was deciphered in Mecp2 transgenic mice (TG3, green) vs the wild-type (TG3, dark blue) counterpart, except for exon-specific increase noted in the case of exon 1, 2, and 9.

