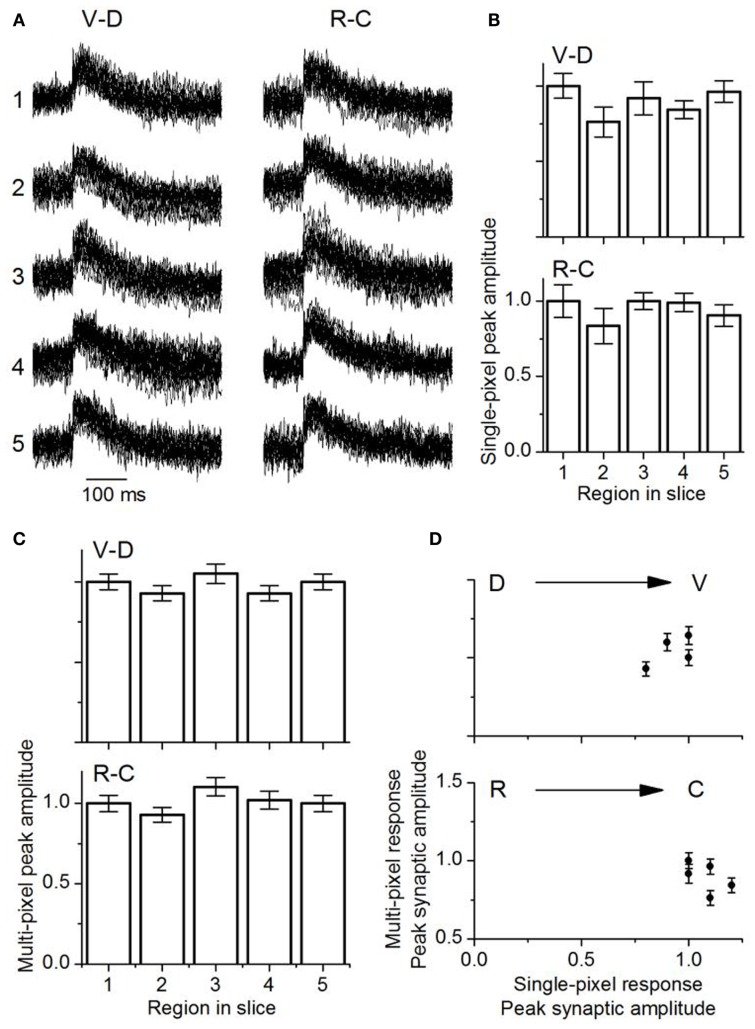
Figure 11.
Comparison of multi-pixel and single-pixel responses in the laminar plane. (A) Overlapped traces from 16 single pixels in the ventral-dorsal (V-D) and rostro-caudal (R-C) directions for a single slice. Rat IC (P26). The numbers one to five correspond to the respective areas in each region as highlighted in Figure 10. The 16 single pixels displayed in each region are the same ones used for multi-pixel analysis. (B) Mean single-peak amplitudes in each direction as indicated (18 slices; SEM.). (C) Mean multi-pixel peak amplitudes in each direction as indicated (18 slices; SEM.). (D) Multi-pixel peak amplitudes as a function of the average single pixel peak amplitude in the dorso-ventral and rostro-caudal directions. The second and fourth data points in the dorso-ventral plot overlap. Averages of 18 slices. Error bars are SEM.

