Figure 14.
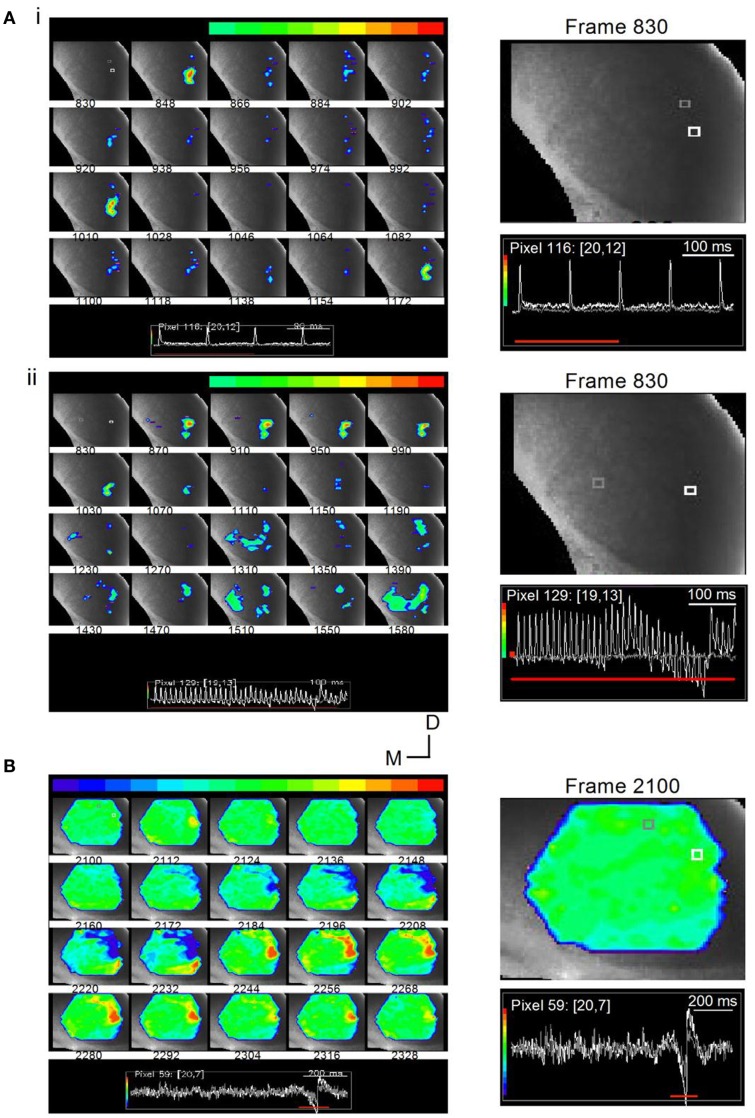
Stimulus-specific microcircuits in the ICC. (A) Time lapse images of responses in a transverse IC slice (mouse; P20) to changing LL stimulus frequencies. (i) Responses to a 10 Hz train are localized to the ventral ICC where LL axons enter. Frames are 12 ms apart. Inset: White and gray traces correspond to the similarly colored pixels in the first frame 830. The pixels chosen are close together to illustrate the spatially restricted nature of the response. While the response at the white pixel is large, there is no response at the gray pixel. Responses in frames 848, 1010, and 1172 correspond to the times of each of the three shocks (100 ms apart). Right panel, Expanded image of the first frame, 830, with inset traces of responses in white and gray pixels; Red line, response area (three of the four shocks) covered by frames 830-1172. (ii) Responses to a 40 Hz train spread and exhibit accumulating non-linearities. Shock current strength is the same as in (i). Frames are 25 ms apart (the same separation as the interpulse interval). The 1–1 stimulus-response coupling as well as the spatially restricted response seen in the early frames (870–1070) is lost during the later part of the train (frames 1310–1590). Inset: Color range is chosen to highlight the depolarizing response. Instances of hyperpolarization, e.g., activity below baseline seen toward the end of the train, are therefore omitted from the total response; Right panel, Expanded image of the first frame, 830, with inset traces of responses in white and gray pixels. (B) Time lapse images of responses in a transverse IC slice (rat; P25) to a 1-s long train at 40 Hz. Shock strength 0.15 mA. Frames are 7.2 ms apart. Response region (frames 2100-2328) corresponds to the inhibitory and excitatory motifs of the rebound region only (inset, red line). Color scale is adjusted so that the baseline is set to green to allow for inhibitory responses to appear toward the blue regions. Frame 2112 shows a small localized depolarizing response. This frame precedes the onset of inhibition (frame 2148) by 22 ms. Directional scale bar applies to (A,B). Right panel, Expanded image of the first frame, 2100, with inset traces of responses in white and gray pixels.

