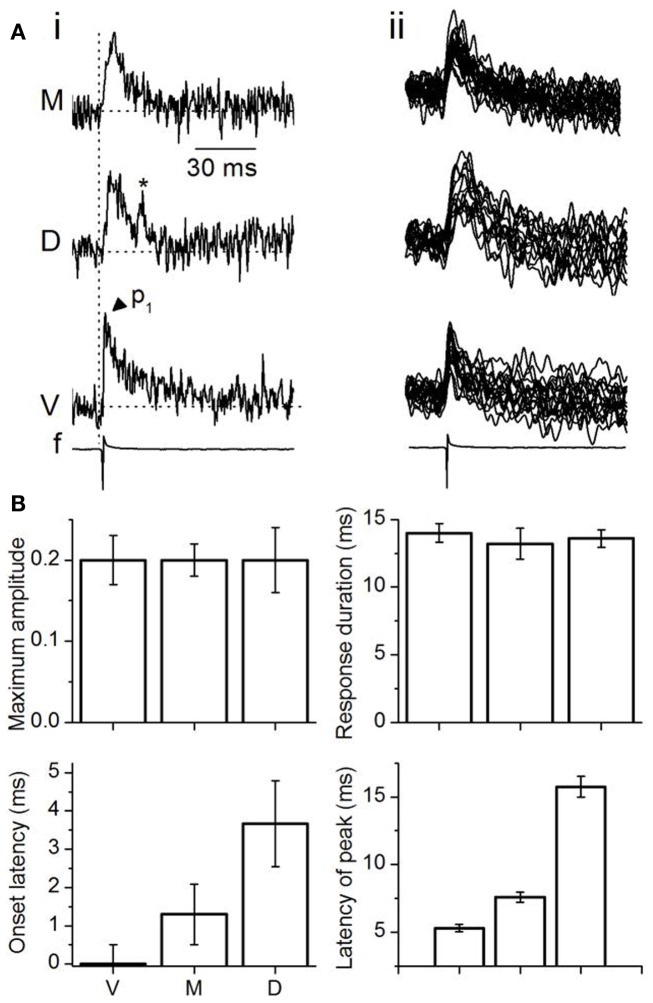
Figure 5.
Analysis of single-pixel responses in the transverse plane. (A) (i) LL-evoked responses in single pixels from different ICC regions. M, medial; D, dorsal; V, ventral ICC; f, field recording. Vertical dotted line, time of response onset in the ventral ICC; p1, single-peak; Asterisk, spontaneous event. (ii) Superimposed traces from 16 single pixels in each region illustrated for the same slice as (i). The 16 pixels picked are the same ones used for multi-pixel analysis. (B) Single-pixel measures of maximum amplitudes, duration of response, onset latency, and time of single-peak. Maximum amplitudes are depicted as fractions of the maximum amplitude of the multi-pixel response in the ventral ICC. Response durations were absolute values, measured at half-maximum amplitude. Onset latencies were measured with respect to the onset of the multi-pixel peak response in the ventral ICC, which was set to zero. Peak time of responses in individual pixels was measured with respect to the average single-pixel onset latency in each region. Averages are from the 16 pixels used for multi-pixel analysis in each region of the slice. Each point is the average of three to four trials from each slice, further averaged over 26 slices. Error bars are SEM.

