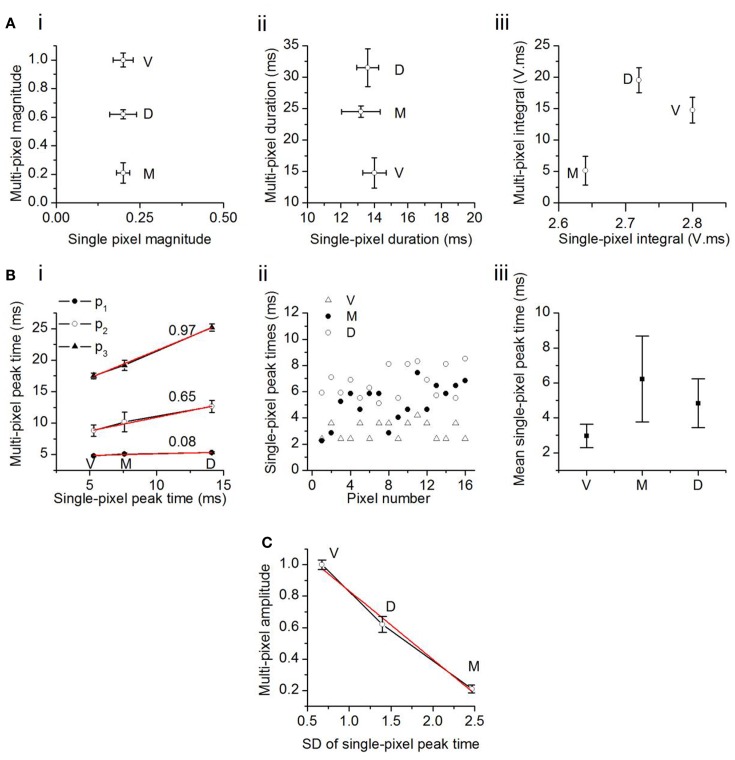
Figure 6.
Comparison between multi- and single-pixel responses in the transverse plane. (A) Multi-pixel measures as functions of the same measures in single-pixel responses. (i) Response magnitude; (ii) duration; (iii) integral of magnitude and duration. The component V in the unit of integral, V. ms, is a fraction of the maximum response in the ventral ICC, and is unitless. Twenty-two slices; mean and SEM. (B) (i) Times of onset of the first, second, and third multi-pixel peaks as a function of the single pixel peak time. Linear fits (r2: p3, 0.998; p2, 0.985; p1, 0.949) with slopes as indicated. V, ventral; M, medial; D, dorsal ICC. (ii) Distribution of single pixel peak times in the ventral, medial, and dorsal regions in one slice. Pixels chosen are the same 16 pixels used for multi-pixel analysis in that slice. (iii) Mean single-pixel peak time in the ventral, medial, and dorsal ICC. Values are mean and SD of data from 14 transverse slices. (C) Maximum amplitude of the multi-pixel response plotted as a function of the SD of the scatter in single pixel peak times. Data from 14 transverse slices. Error bars are SEM. Red line, linear fit, r2 = 0.987.

