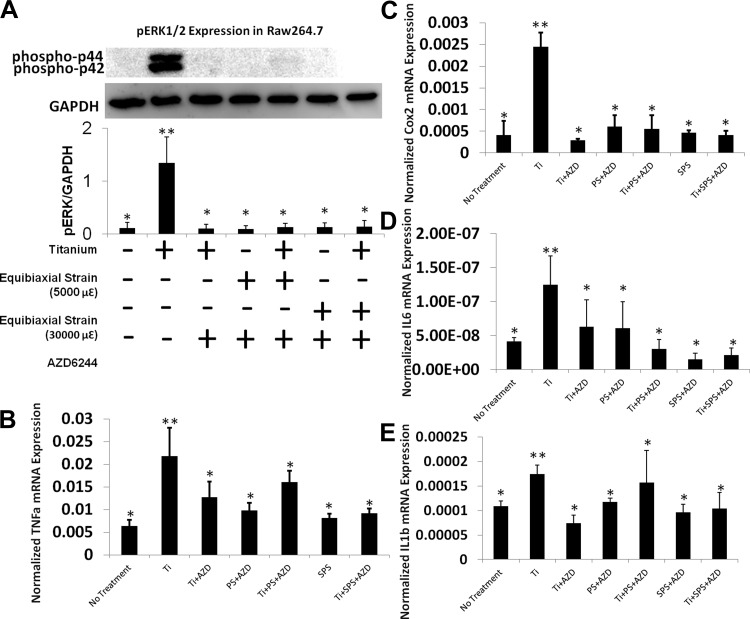
Fig. 8.
Role of the ERK pathway as an inflammatory cascade in RAW 264.7 cells. A: immunoblot showing selective inhibition of pERK1/2 by AZD in RAW 274.7 cells. Each symbol denotes significant difference (P < 0.05); n = 3. B–E: relative gene expression of Cox2, IL-6, TNFα, and IL-1β after AZD pretreatment in RAW 264.7 cells with no treatment, Ti, Ti + AZD, PS + AZD, PS + Ti + AZD, SPS + AZD, or SPS + Ti + AZD. Gene expression assays were normalized by GAPDH. Each symbol denotes significant difference (P < 0.05); n = 6 per group.

