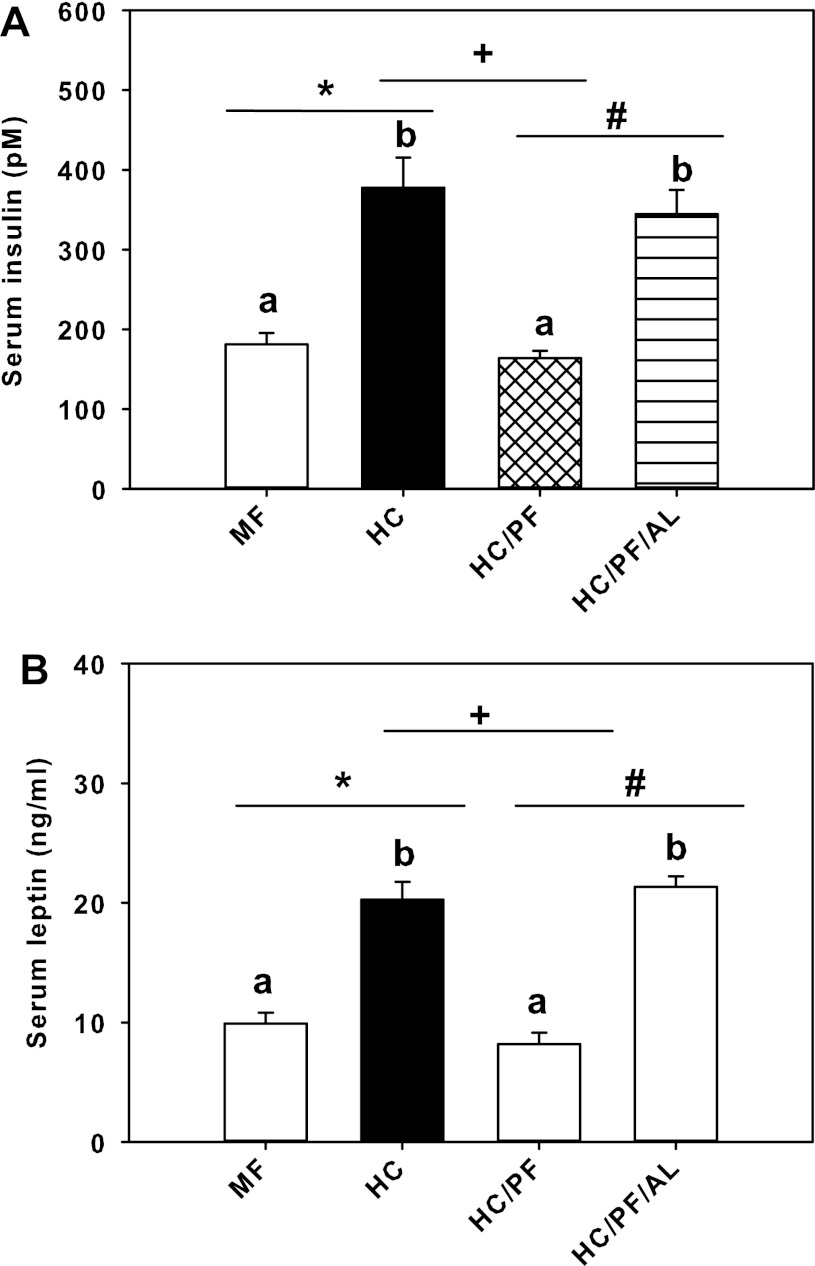
Fig. 3.
Serum insulin (A) and leptin levels (B) in 140-day-old MF, HC, HC/PF, and HC/PF/AL rats. The results are means ± SE of 8 rats/group. *P < 0.05 for HC compared with MF; +P < 0.05 for HC/PF compared with HC; #P < 0.05 for HC/PF/AL compared with HC/PF (ANOVA followed by post hoc analysis using the Student-Newman-Keuls method). aNo significant differences between MF and HC/PF groups of rats; bno significant differences between HC ad HC/PF/AL groups of rats.

