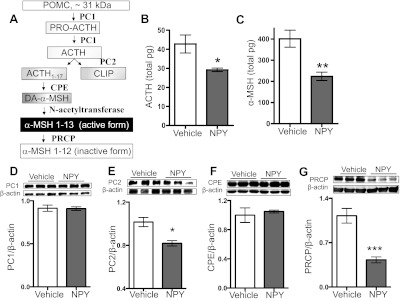
Fig. 2.

NPY administration reduced POMC-derived peptides and POMC processing enzyme PC2 levels. See text for definitions. A: simplified model of the POMC processing cascade is depicted and has been described in the pituitary and the hypothalamic ARC. B and C: ACTH and α-MSH were measured in the same ARC samples collected 60 min after icv infusion of NPY (5 μg) or vehicle control. B: ACTH peptide content (control n = 6, NPY n = 4; t-test with Welch's correction, P = 0.0369). C: α-MSH peptide content (control n = 6, NPY n = 4; t-test, P = 0.0096). These results were repeated with the same response in a separate experiment, n = 9/group. D: PC1 protein levels (control n = 6, NPY n = 5; t-test, P = 0.92). E: PC2 protein levels (control n = 6, NPY n = 4; t-test, P = 0.034). These results were repeated with the same response in 2 independent experiments, n = 4/group/experiment. F: CPE protein levels (control n = 6, NPY n = 5; t-test, P = 0.60). G: PRCP protein levels (control n = 5, NPY n = 4; t-test, P = 0.0015). Data are means ± SE. *P < 0.05, **P < 0.01 vs. control.
