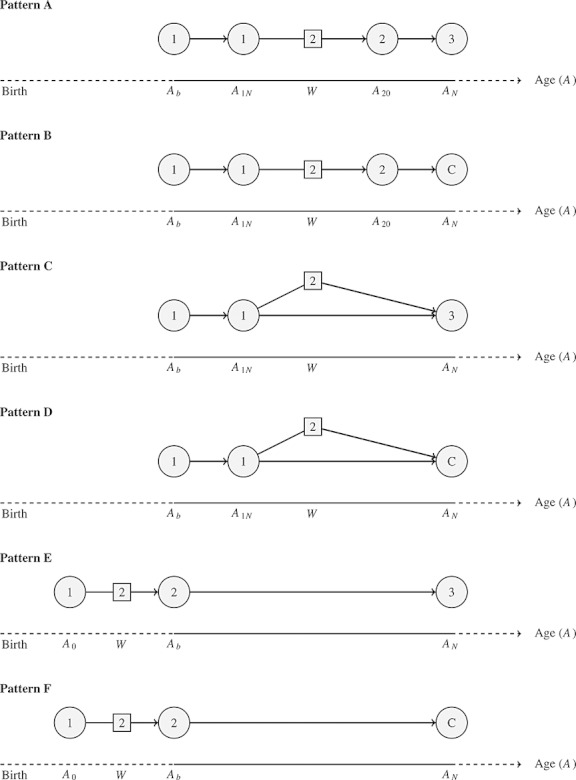
Figure 3.

Data patterns with regard to possible transitions between the three states. C denotes censoring. A0 is age at which all individuals are assumed to be healthy, Ab is age at baseline, A1N is age at the last time an individual is observed in state 1, A20 is age at the first time an individual is observed in state 2, AN is age at the end of the follow-up, and W is age at the time of transition from state 1 to state 2.
