Fig. 4.
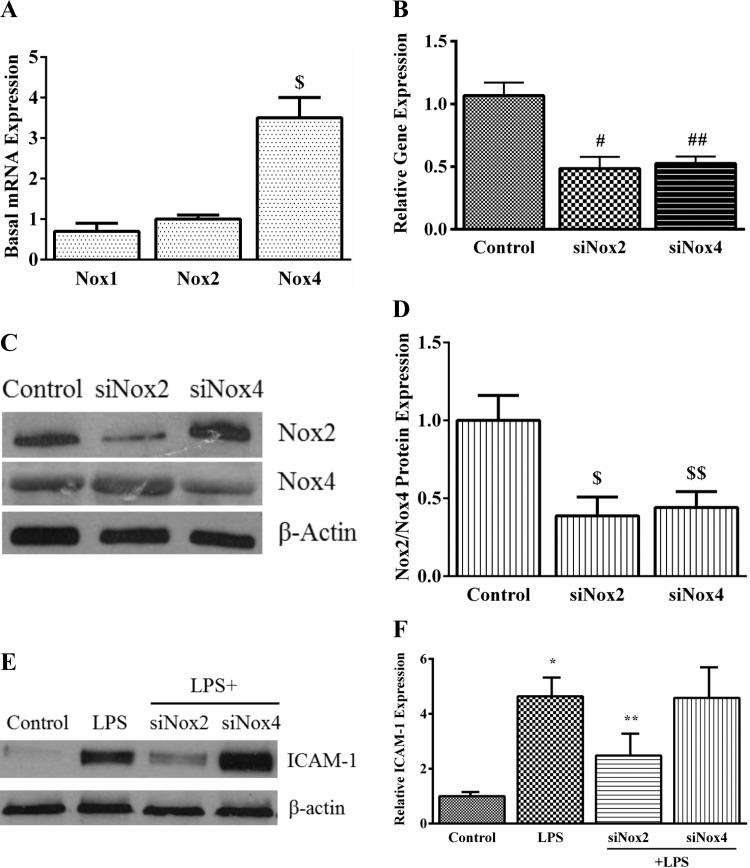
The effect of Nox2 and Nox4 siRNA on LPS-induced ICAM-1 expression in HPMEC. A: basal mRNA expression of Nox1, Nox2, and Nox4 was quantified by real-time PCR in control HPMEC. GAPDH was used as the housekeeping gene. The graph shows Nox1 and Nox4 mRNA expression relative to Nox2. *P = 0.01 (Nox2 vs. Nox4), n = 3. B: Nox2 and Nox4 mRNA expression was quantified by real-time PCR in whole cell lysates 48 h after siRNA treatment. #P < 0.001 (control vs. siNox2 cells); ##P = 0.002 (control vs. siNox4 cells), n = 5. C and D: Nox2 and Nox4 protein were quantified in whole cell lysates 48 h after silencing with specific siRNA by immunoblotting. Representative blot (C) and cumulative data from 3 experiments are shown (D). $P = 0.001 (control vs. siNox2); $$P = 0.006 (control vs. siNox4), n = 3. E and F: ICAM-1 expression was quantified 24 h after LPS treatment in control, LPS-treated, LPS+siNox2, and LPS+siNox4 cells by Western blotting. Representative blot (E) and cumulative data from 5 experiments are shown (F). *P < 0.001 (control vs. LPS-treated); **P = 0.004 (LPS vs. LPS+siNox2), n = 5.

