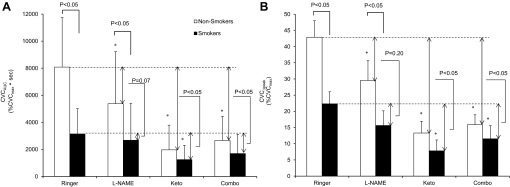
Fig. 2.

Cutaneous vasodilation responses to 1-min 137.5 μM acetylcholine administration in all drug treatment sites evaluated as area under the curve (CVCAUC; A) and baseline to peak value (CVCΔpeak; B). Values are means ± SE. *P < 0.05, vs. Ringer site within group. Comparisons are made between smokers and nonsmokers, between the CVC for each site, and between the differences in CVC from the Ringer site in the corresponding group.
