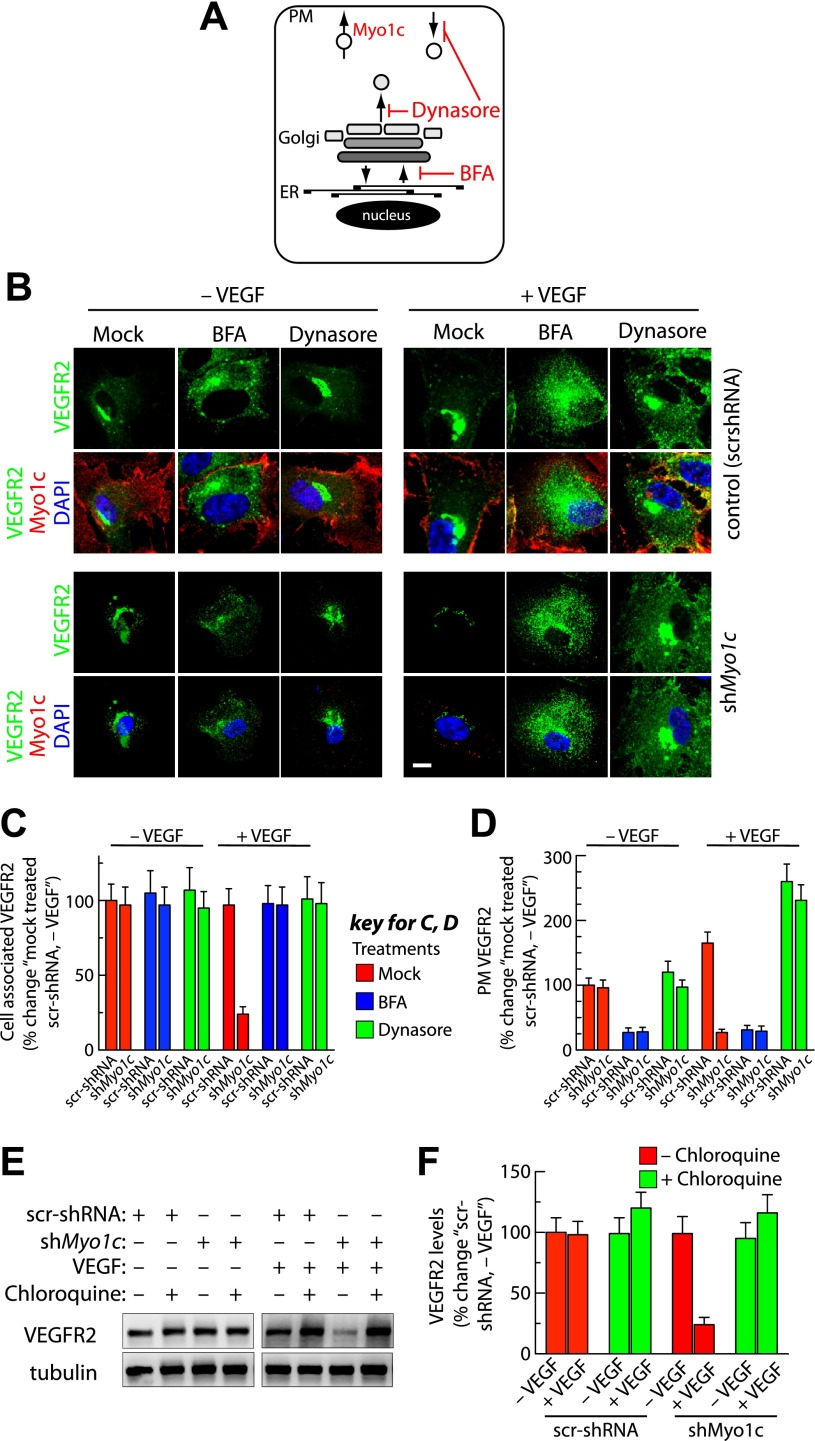
Fig. 5.
Myo1c depletion targets post-Golgi and PM pool of VEGFR2 for degradation in response to VEGF stimulation. A: schematic diagram showing the direction of vesicular cargo transport along endocytic and secretory pathways, as well as the known intracellular sites of action of brefeldin A (BFA), dynasore, and proposed site where Myo1c may be involved in facilitating VEGFR2 delivery to the PM. ER, endoplasmic reticulum. B: stable cells were serum starved for 6 h. Cells were then either mock pretreated or pretreated with BFA (1 μg/ml, 2 h) or dynasore (80 μM in DMSO, 2 h) before being cultured in the absence or presence of VEGF (50 ng/ml, 30 min) in medium containing respective inhibitors. Cells were then fixed, permeabilized, and labeled with Abs specific for VEGFR2 and Myo1c, followed by incubation with the appropriate fluorescently tagged secondary Ab. Representative images obtained by epifluorescence microscopy show localization of VEGFR2. Scale bar represents 5 μm. C: quantification of intracellular retention of VEGFR2 upon BFA and dynasore treatments as in B. Total cell-associated fluorescence was quantified by image analysis. Values represent relative changes in the levels of VEGFR2 normalized to an arbitrary value of 100% for mock-treated control (scr-shRNA, -VEGF). Results are expressed as means ± SE; n = 70 cells for each condition from 3 separate experiments and P ≤ 0.03. D: in a similar study as in B, confocal imaging was performed to quantitatively access VEGFR2 levels at the PM. Fluorescence signal of VEGFR2 at cell periphery from the confocal images was quantified by Metamorph image analysis. Value represents mean ± SD; n = 30 cells for each condition from 3 separate experiments and P ≤ 0.05. E: Stable scr-shRNA or shMyo1c cells were serum starved for 6 h before treatment for an additional 6 h with or without chloroquine (100 μM). Pretreated samples were then incubated in the presence or absence of VEGF in medium with or without chloroquine. F: quantification of band density for total VEGFR2. Values are expressed as the percent changes in VEGFR2 [relative to scr-shRNA (−VEGF)]. The percentage represents mean ± SD for n = 3 and P ≤ 0.05.

