
Figure 3.
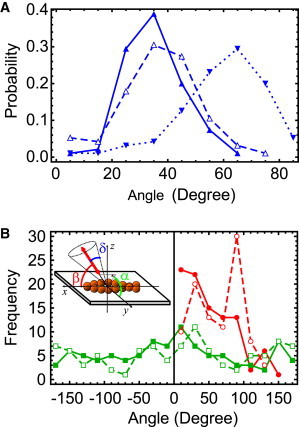
Distributions of probe angle and wobble before and after steps including a detectable high-wobble state (98 events in 73 molecules). (A) The distributions of δ (blue) during the intervals immediately before (▲ with solid line) and after (▵ with dashed line) steps in which a high wobble state was detected peak at lower values (∼30°) compared with the distribution of δ during the high-wobble state (▾ with dotted line), which peaks at large values (∼70–80°). (B) Distributions of β (red) and α (green) during the intervals immediately before (● and ▪ with solid lines) and after (○ and □ with dashed lines) steps with detectable high-wobble states. Steps with a high-wobble state allow trailing and leading lever arm states to be identified unambiguously as the intervals before and after the step, respectively. The inset illustrates the angle conventions for β, α, and δ relative to the actin filament.