
Figure 10.
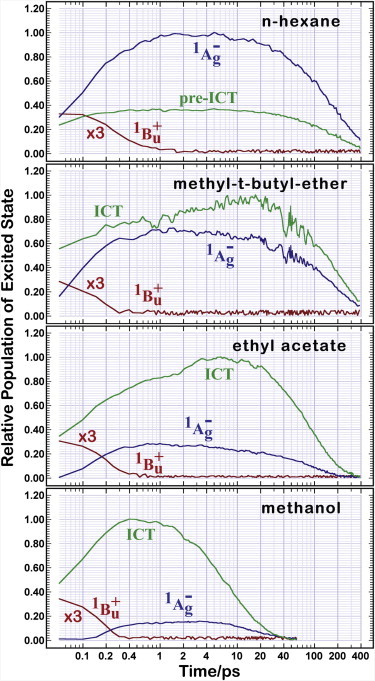
Relative population of the excited states in peridinin as a function of time in various solvents. The populations are based on an analysis of the transient absorption spectra (Fig. 5) and adjusted for oscillator strength (see text). Note that the horizontal time axis is logarithmic.