
Figure 7.
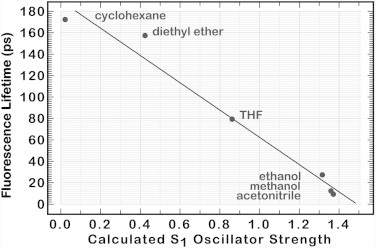
Observed fluorescence lifetime of peridinin plotted versus calculated oscillator strength of the first excited singlet state for selected solvents. Oscillator strength data are from Fig. 6. Fluorescence-lifetime data are from Table 3 of Frank et al. (16). The approximate linear relationship is fortuitous, as Eq. 1 would predict a more quadratic relationship. However, the trend is in the correct direction, illustrating the realistic nature of the course features of our model.