Fig. 3.
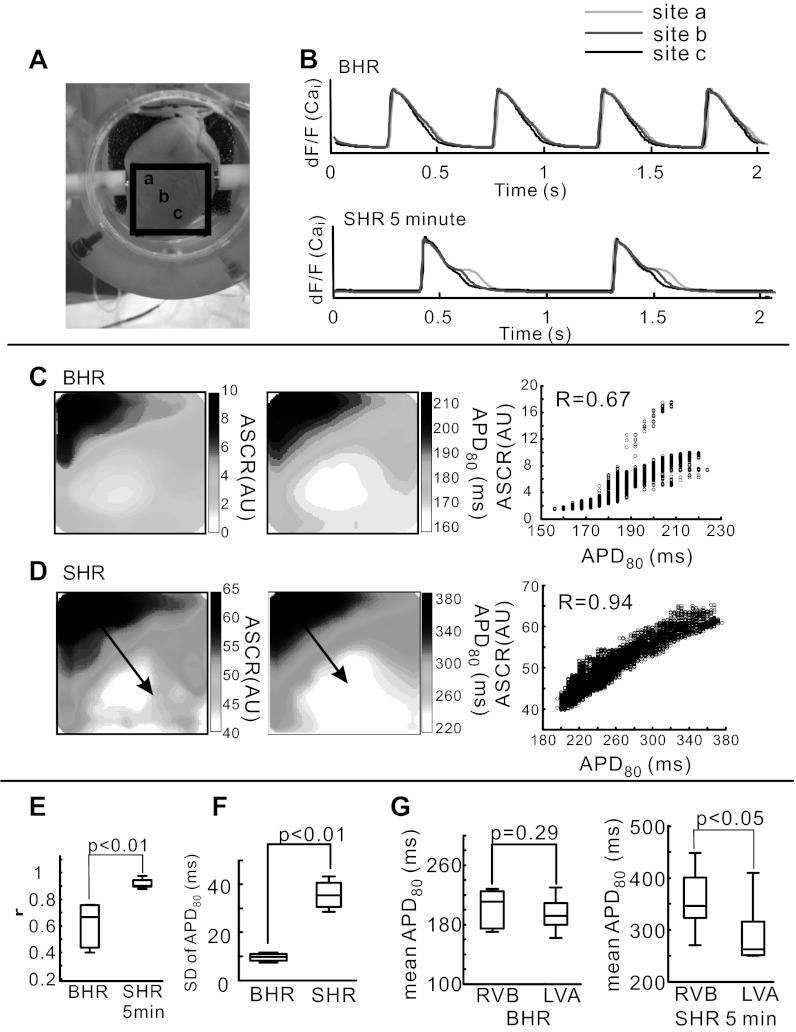
Dispersion of amplitudes of SCR (ASCRs) and APD80 in BHR and SHR. A: picture of the anterior surface of the heart with a black box identifying the region of the heart viewed by the CMOS cameras. B: superimposed optical traces of Cai from base of right ventricle (RVB; site a) to apex of left ventricle (LVA; site c) that are identified in A. C: spatial correlation between APD80 (left) and ASCRs (middle) at steady-state BHR. A scatterplot of APD80 and ASCRs represents spatial correlation (right). Spatial correlation coefficient (r) was calculated in 100 × 100 pixels at BHR and SHR. D: as for C, but at 5 min of SHR. E: statistical comparison of r between APD80 and ASCRs at steady-state BHR and 5 min of SHR. F: SD of APD80 at steady-state BHR and 5 min of SHR. SD was used as a measure of dispersion and was calculated from 10,000 recordings (100 × 100 pixels) at BHR baseline and after 5 min of SHR. G: mean APD80 measured at BHR from RVB (24 pixels) and LVA (24 pixels) was not significantly different (left), but after 5 min of SHR, mean APD80 was significantly longer at RVB than LVA (middle) and as a percent change in APD80 (right). AU, arbitrary unit, dF/F, fractional fluorescence change.

