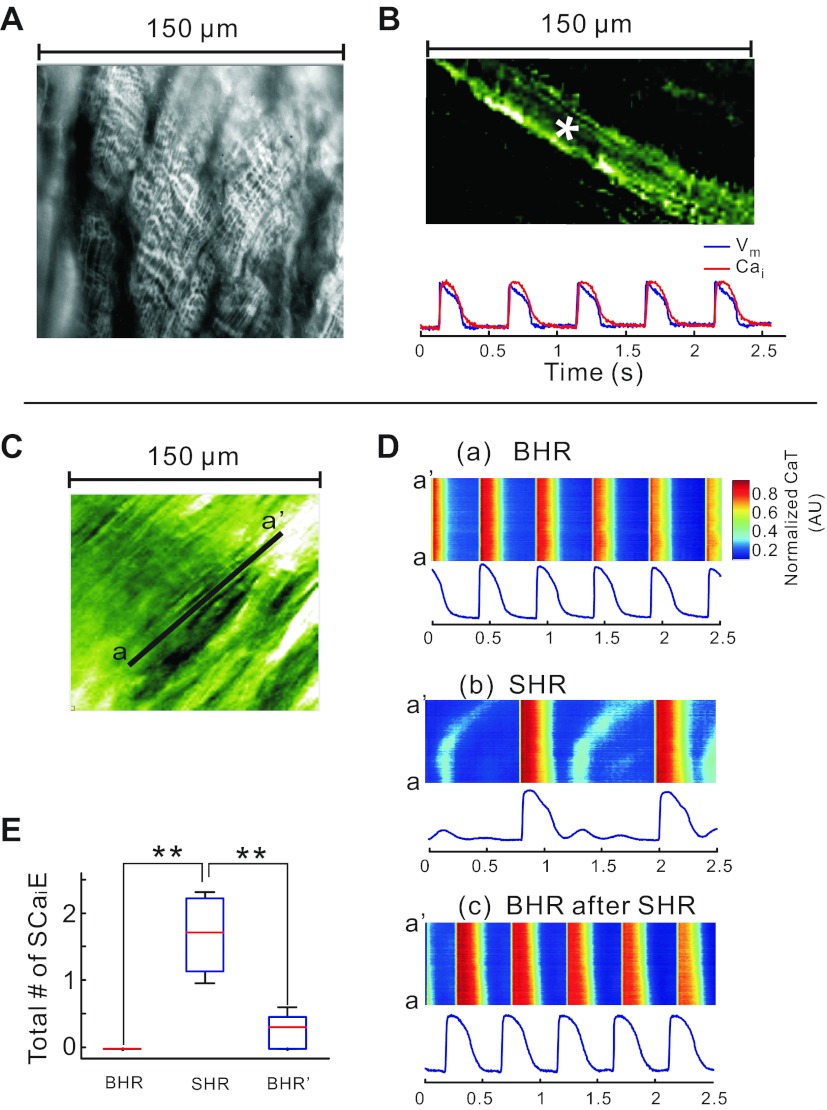
Fig. 4.
Bradycardia-induced subcellular secondary Ca2+ release (SCR) in systole and Ca2+ waves in diastole. A: image of transverse tubules with nonconfocal microscopy; the transverse tubules of striated myocytes from a rabbit heart stained with 4-[β-[2-(di-n-butylamino)-6-naphthyl]vinyl]pyridinium (di-4-ANEPPS) were readily observed using a ×40 objective. B: dual subcellular mapping of APs and CaT from an epicardial myocyte of a Langendorff-perfused rabbit heart stained with PGH-1 and Rhod-2 AM; PGH-1 fluorescence image (top) and optical traces of APs (blue) and CaT (red) from the site marked with an asterisk (top). C: subcellular 150 × 150 μm2 field of view seen through Rhod-2 fluorescence. D: CaTs recorded along the line a–a′ identified in C and displayed in a familiar line scan format: CaT during BHR (top), CaT during SHR (middle), and back to CaT during BHR after 5 min SHR (bottom). CaT fluorescence tracings were recorded from a pixel (1.5 × 1.5 μm2) at the center of the line a–a′. Note that SHR leads to low-amplitude Cai instabilities and subcellular waves during diastole that are not seen at low magnification and disappear at BHR. Subcellular diastolic Cai waves were not synchronized among the neighboring cells. They were averaged out at low magnification. A supplementary movie file is provided to visualize the spatial and temporal heterogeneities of systolic and diastolic Cai (supplementary movie 1). E: statistical comparison of the number of secondary Ca2+ elevations (SCaiE; includes both systolic and diastolic elevations) between BHR, SHR, and return back to BHR. The data are derived from all the pixels in the field of view. **P < 0.001.

