
Figure 3.
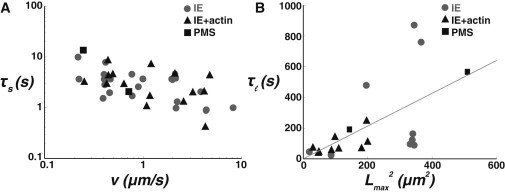
Timescales of force relaxation after tube elongation. (A) Short force relaxation time τs (from fmax to frelax) as a function of the extrusion velocity v for PMS (black squares), liposomes prepared by IE (grey dots), and IE with a reconstituted actin cortex (black triangles). (B) Long force relaxation time τl (from frelax to f0) as a function of the square of the nanotube length Lmax for PMS (black squares), liposomes prepared by IE (grey dots), and IE with a reconstituted actin cortex (black triangles).