
Figure 11.
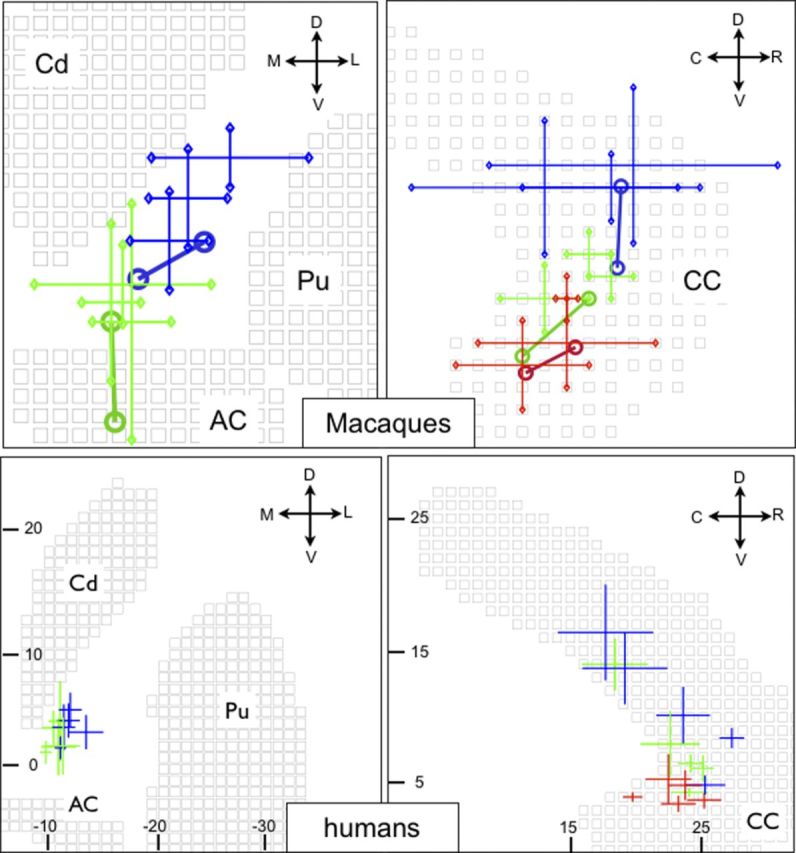
Reproducibility of the trajectories within the IC and CC across 5 humans and 3 macaques. Left panels represent IC; right panels, CC. Top panels, macaques; bottom panels, humans. The crosses represent the position of the probabilistic trajectories from tractography. The crosses are centered on the mean trajectory, and the length of the branches along each axis corresponds to the region with 90% of the probability mass. Top, Tracer data from two injections per site are also shown (centers of gravity of the pathways displayed as open circles connected by a line to help visualization). Blue represents lOFC; green, cOFC; red, vmPFC. Cd, Caudate; Pu, putamen. Orientation: R, Rostral; C, caudal; D, dorsal; V, ventral; M, medial; L, lateral.