Figure 3.

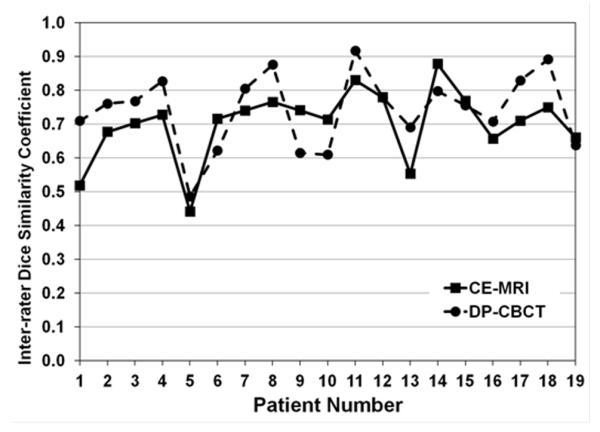
CE-MRI (A) and DP-CBCT (B) images after tumor segmentation was done by the three readers. The red, green, and yellow lines indicate where each reader segmented and the highlighted blue-green region represents the common area segmented by all readers. The tumor segmentation is magnified and represented in the white box. The inter-rater DSC was 0.75 for CE-MRI and 0.89 for DP-CBCT.
