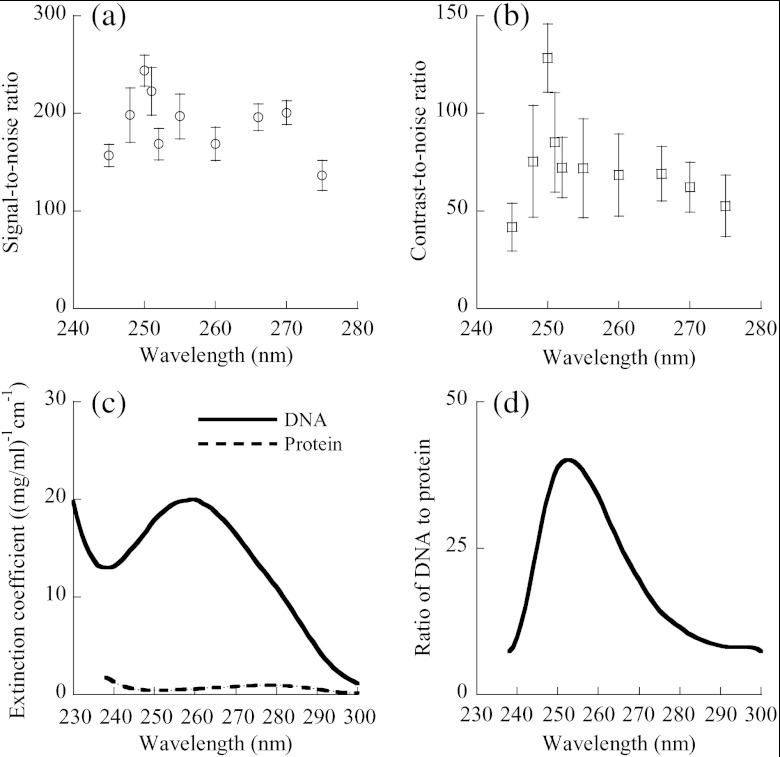
Fig. 4.
Signal and contrast of in vivo photoacoustic images of cell nuclei versus the optical wavelength. (a) Plot of SNR () of nuclear images versus wavelength. The SNR was collected from 25 cell nuclei in MAP photoacoustic images for each wavelength. (b) Plot of CNR () of nuclear images versus wavelength. The mean was calculated from 25 nuclei. (c) Typical absorption spectra of DNA and protein. The DNA is thymus DNA, and the protein is glutamate dehydrogenase. The absorption spectrum of DNA is adapted from Kunitz (1950) and Sambrook et al. (2001), and that of protein from Olson et al. (1952) and Gill et al. (1989). (d) The ratio of DNA to protein, defined as the ratio of the absorption coefficient of thymus DNA to that of glutamate dehydrogenase.

