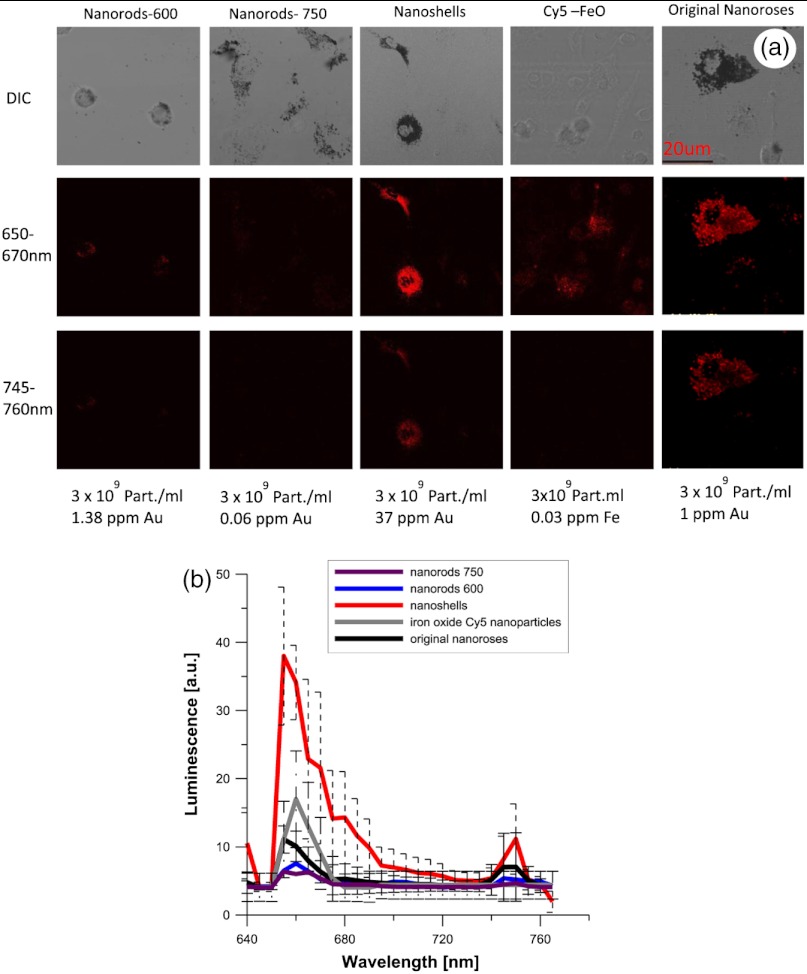
Fig. 3.
(a). Confocal images of various near-infrared nanoparticles in macrophages cell culture. Gray upper panels are differential interference contrast microscopy images (DIC) of macrophages, and two red lower panels represent luminescent images at two wavelengths at 650 to 670 and 745 to 760 nm. Second emission at 745 to 760 nm was not observed from Cy5 iron oxide nanoparticles. (b). The calculated luminescence intensity profile from macrophages/each nanoparticles, shows that nanoshells produced a signal approximately four times stronger than original nanoroses.

