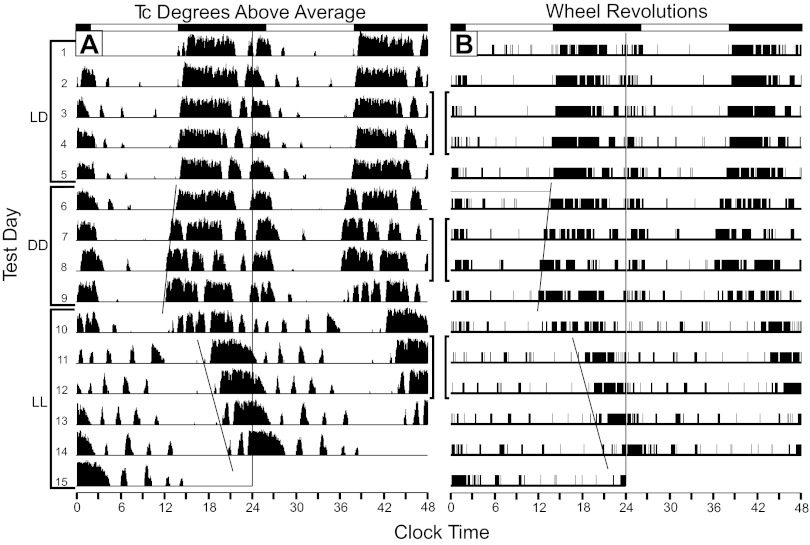
Fig. 1.
Raster plots showing 15 consecutive test days of simultaneously collected Tc (A) and wheel-running (B) data from a mouse exposed to 12:12-h light-dark cycle, constant darkness (DD), then constant light (LL). The days corresponding to each lighting condition are indicated by the left side brackets. The Tc data were collected every 5 min via an iButton. The ordinate for each day's Tc data indicates the extent to which Tc exceeded the average Tc of the entire data collection interval. The two data types were collected and plotted using different analysis/plotting software producing an analog plot for the Tc data and an all-or-none digital plot for the wheel-running data. The identical eye-fitted lines through the daily onsets of rising Tc and wheel-running illustrate equality of the circadian periods of the two rhythms during DD and LL. Brackets between the two plots indicate the days used for further analysis of Tc and wheel-running (see text and Fig. 2).

