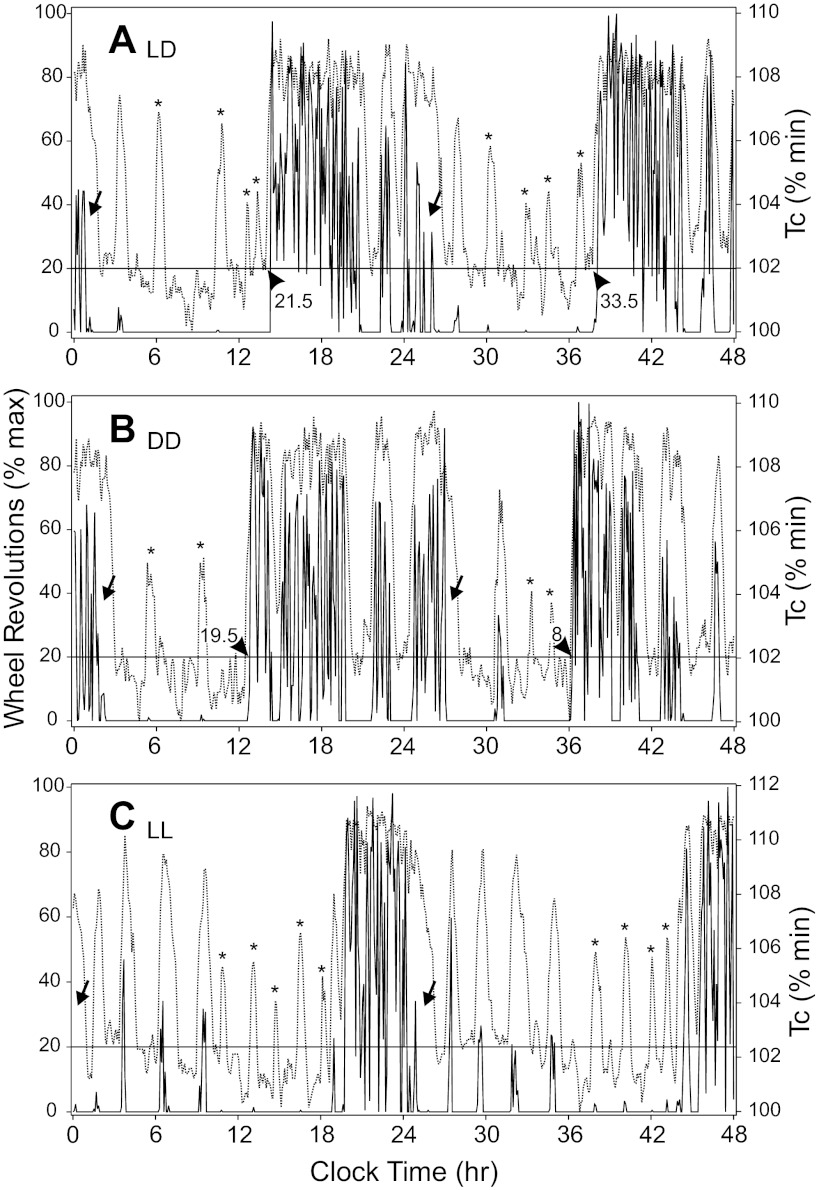
Fig. 2.
Two-day Tc and wheel-running data plots during LD (A), DD (B), and LL (C) for the animal whose raster records of the same measures (bracketed 2-day intervals) are shown in Fig. 1. Arrowheads indicate where Tc (broken lines) rise in advance of the daily nocturnal active phase, as indicated by wheel-running (solid lines). Numbers adjacent to the arrowheads indicate the phase difference, in minutes, between the temperature and wheel-running plots, as measured at the horizontal black line indicating the 20% maximal wheel-running rate (see text). The relatively earlier rise in Tc occurred in all animals under all test conditions. Arrows indicate intervals at the end of the active phase during which Tc remains high, while wheel-running is low. Asterisks identify Tc spikes with very little or no associated wheel-running.

