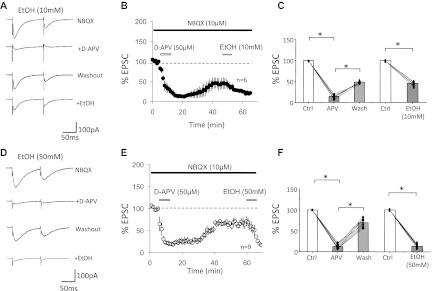
Fig. 2.

Ethanol inhibits d-APV-sensitive currents. A–C: effects of 10 mM EtOH. A: typical traces. First trace: CF-EPSCs recorded in the presence of NBQX. Second trace: d-APV inhibition of the NBQX-resistant currents. Third trace: recovery from d-APV inhibition. Fourth trace: inhibition of the recovered NMDA receptor-mediated current by 10 mM EtOH. B: time graph showing EtOH inhibition of NMDA receptor-mediated CF-EPSCs (EPSC1; n = 6). Bars indicate periods of drug application. After a stable baseline was established in the presence of NBQX (10 μM; black bar), d-APV (50 μM) was applied until steady inhibition was achieved (white bar). Subsequently, d-APV was washed out and the NMDA receptor-mediated current was allowed to recover before the application of EtOH (10 mM; grey bar). C: bar graph showing the reduction of NBQX-resistant currents by d-APV (50 μM), d-APV washout, and suppression by 10 mM EtOH (n = 6). Amplitude of recovered EPSCs after d-APV washout was normalized to baseline values before calculating the EPSC reduction in the presence of EtOH. D–F: effects of 50 mM EtOH. D: typical traces show the suppression of d-APV-sensitive currents by 50 mM EtOH. E: time graph showing EPSC blockade by d-APV, recovery after washout, and subsequent suppression by 50 mM EtOH (n = 9). F: bar graph showing the reduction of NBQX-resistant currents by d-APV (50 μM), d-APV washout, and suppression by 50 mM EtOH (n = 9; *P < 0.05; paired Student's t-test). Error bars are means ± SE.
