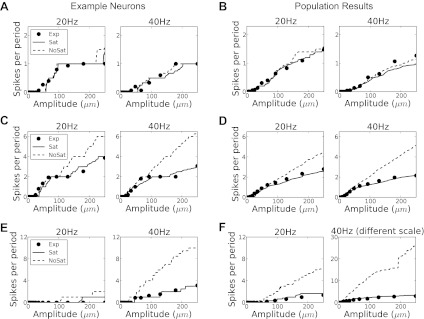
Fig. 7.

Rate intensity functions. Dots denote observed rates, solid lines, rates predicted using the full model, and dashed lines, predicted rates without saturation. A and B: SA neurons. C and D: RA neurons. E and F: PC neurons. A, C, and E: responses of representative individual neurons and the corresponding model predictions; B, D, and F: means over all neurons in each afferent category. Note the different scales of the ordinates in F.
