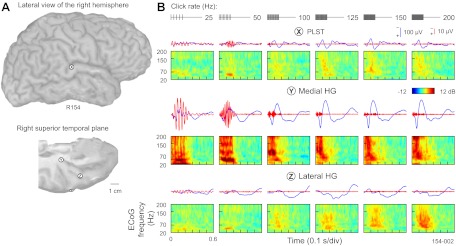
Fig. 7.

Comparison of responses to click trains between PLST and 2 recording locations within Heschl's gyrus (HG). A: location of 3 exemplary recording sites—a representative PLST site, a presumed core cortex site in medial HG, and a site in a nonprimary field on lateral HG (marked by X, Y, and Z, respectively) in a representative subject. B: AEPs, FFRs, and ERBP obtained from PLST, core auditory cortex in medial HG, and a non-core field in lateral HG (top to bottom). Stimuli: 160-ms click trains, presented at rates between 25 and 200 Hz (left to right). Stimulus schematics are shown in top rows.
