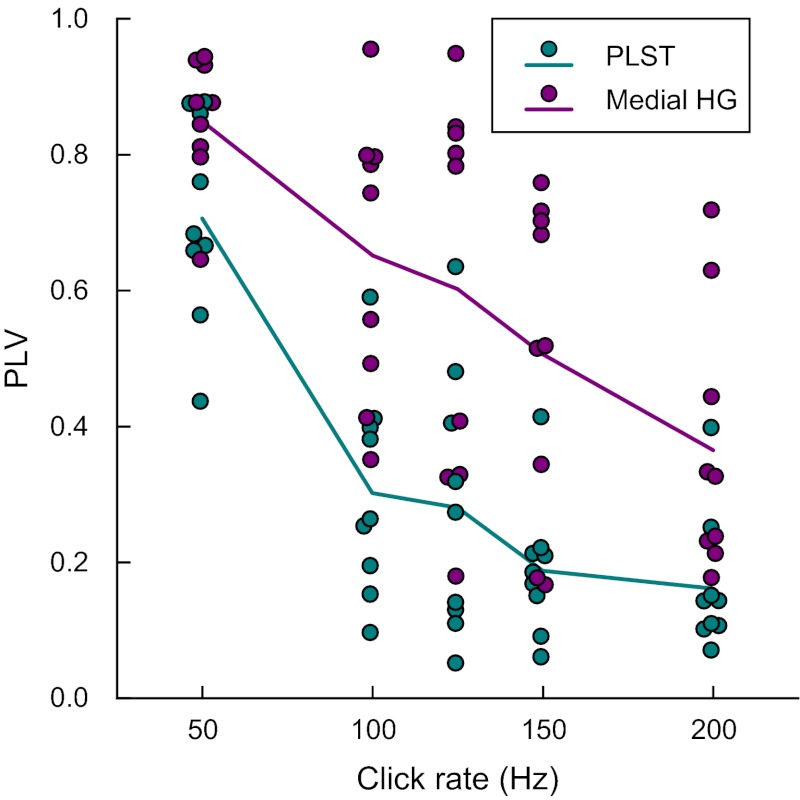
Fig. 8.
Phase locking in medial HG and PLST. Summary of data from 9 subjects (L145, L162, L178, R149, R152, R153, R154, R180, and R186). PLVs are plotted as functions of click rate for sites within PLST and medial HG (teal and purple circles, respectively). Data from 1 medial HG and 1 PLST site that exhibited the highest PLVs at 50 Hz in each subject are shown. Purple and teal lines represent across-subject mean PLVs for medial HG and PLST sites, respectively. A small amount of variability was added to the abscissa values to make individual data points more visible.

