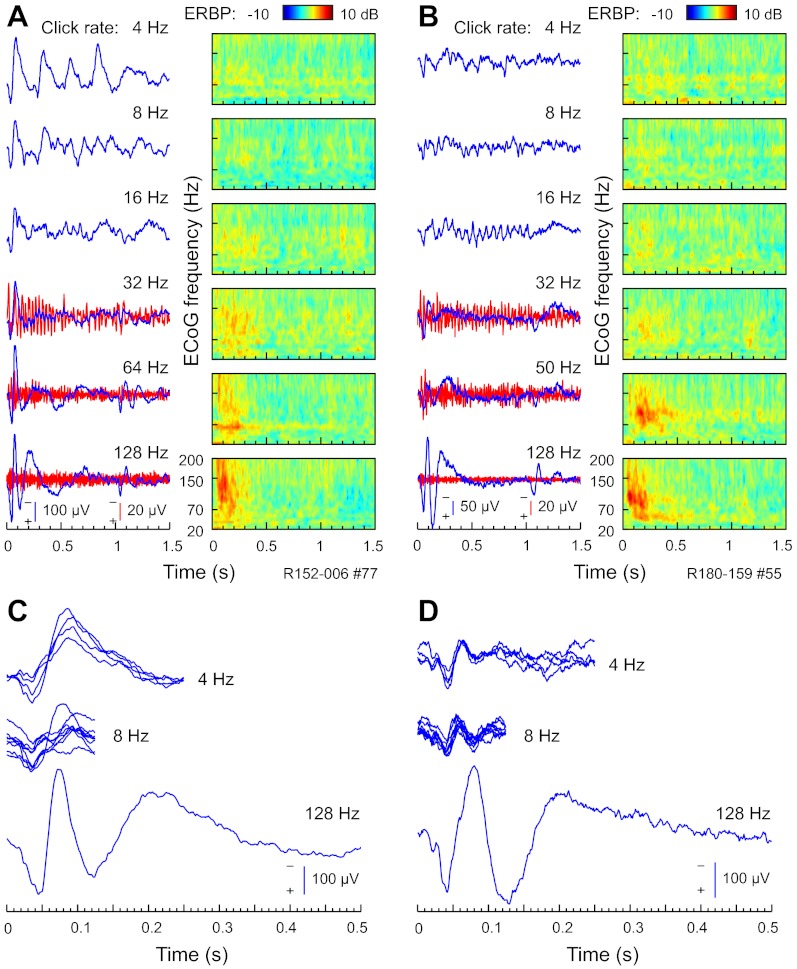
Fig. 9.
PLST responses to 1-s click trains. A and B: all-pass (1.6–500 Hz) and high-pass (cut-off 1 octave below driving frequency) AEP waveforms (blue and red traces, respectively) and ERBP (color plots), elicited by click trains of rates between 4 and 128 Hz (top to bottom). Exemplary data from 2 representative right-hemisphere sites in 2 different subjects (R152 and R180, A and B, respectively). At a relatively low rate of 4 Hz, each click in the train evoked a distinct AEP complex (top plots in A and B). C and D: AEP waveforms recorded in response to 4- and 8-Hz click trains are replotted by fragmenting and superimposing the portions of the AEP waveform that were recorded between consecutive clicks in the click train. The 1st 500 ms of the AEP waveforms elicited by 128-Hz click trains is plotted below.

