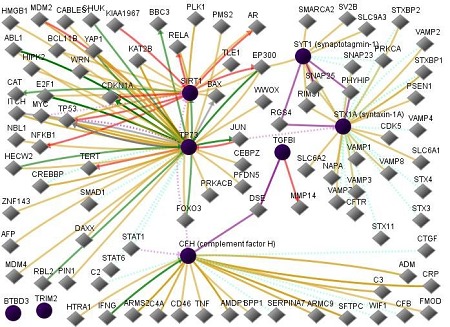
Figure 1.

Network of input proteins (complement factor H, synaptotagmin-1, syntaxin-1A, TP73, TGFBI, TRIM2, SIRT1, andBTBD3) and the input neighbors of these proteins. In this figure, line-colors and various interactions with other genes are red Down-regulation, green Up-regulation, beige Regulation, purple Co-expression, brown Physical Interaction, turquoise dotted Predicted Protein Interaction, and mauve dotted Predicted TFactor Regulation (www. sabiosciences.com).
