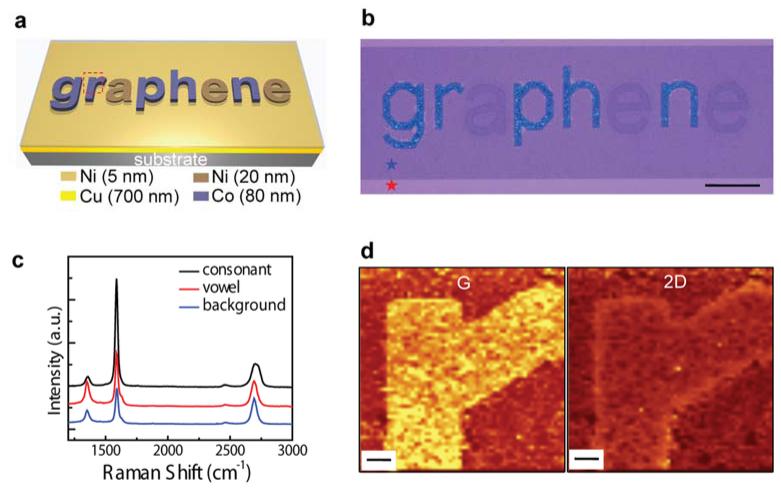
Figure 1. Synthesis of monolithic graphene-graphite structures using heterogeneously patterned catalyst metal films.
a, Schematic illustration of alphabetic catalyst patterns. b, Optical micrograph of the graphene-graphite structures synthesized from the catalysts shown in Fig. 1a. The areas marked with red and blue stars represent SiO2 and 2-4 layer graphene, respectively. Scale bar, 200 μm. c, Raman spectra from different regions (consonant, vowel, and background). d, Raman intensity maps of G (1537-1624 cm−1) and 2D (2632-2778 cm−1) bands in the region of alphabet pattern ‘r’. Scale bars, 10 μm.

