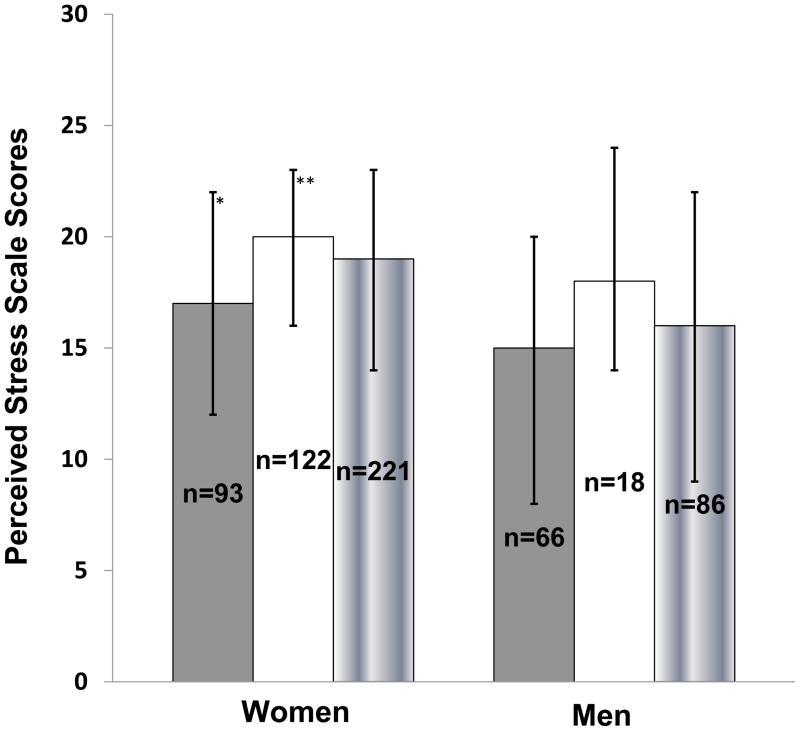
Figure 4.
Median Perceived Stress Scale scores (PSS) in women and men with (gray bar), without (white bar) metabolic syndrome (using modified ATP III criteria), and the total group (gradient bar); Error bars represent inter-quartile range (IQR; 25th percentile, 75th percentile); *P< 0.05, PSS in women with vs. without metabolic syndrome; **P = 0.005, PSS in women vs. men.

