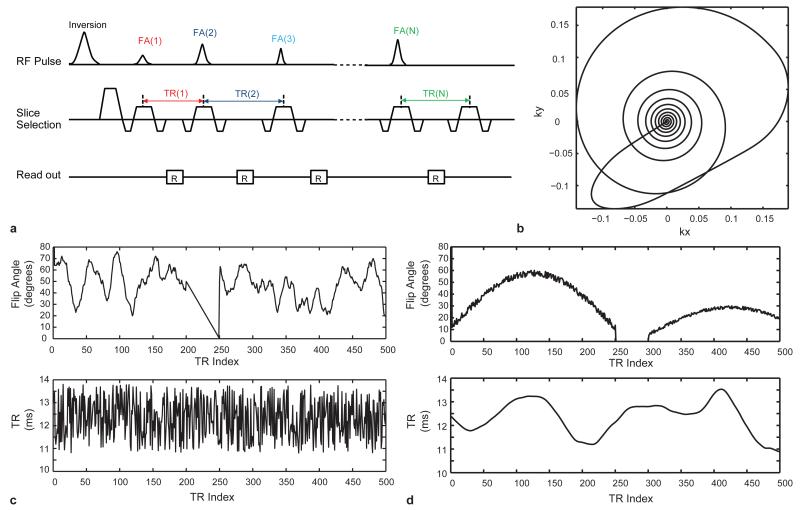
Figure 1. MRF sequence pattern.
a, Acquisition sequence diagram. In each TR, various sequence components are varied in a pseudorandom pattern. b, Here, one variable density spiral trajectory was used per TR. The trajectory rotated from one TR to the next. c and d are examples of the first 500 points of FA and TR patterns that were used in this study.

