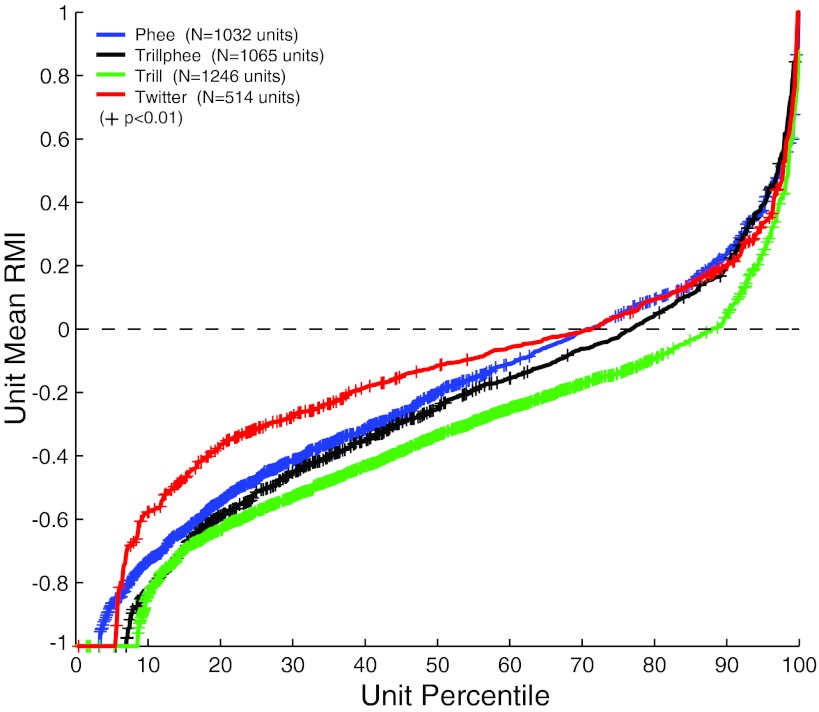
Fig. 10.
Population distributions of vocal RMIs for individual units. Shown are cumulative distribution functions for mean RMIs calculated individually for each unit. Separate curves are plotted for each call type and show overall similar trends. Trills were more likely to be suppressed, and twitters less, than phees and trillphees. Depending on the call type, between 70% and 88% of units were suppressed (RMI < 0) during vocalization. +, Units with significant vocal modulations (N ≥ 4 calls, P < 0.01).

