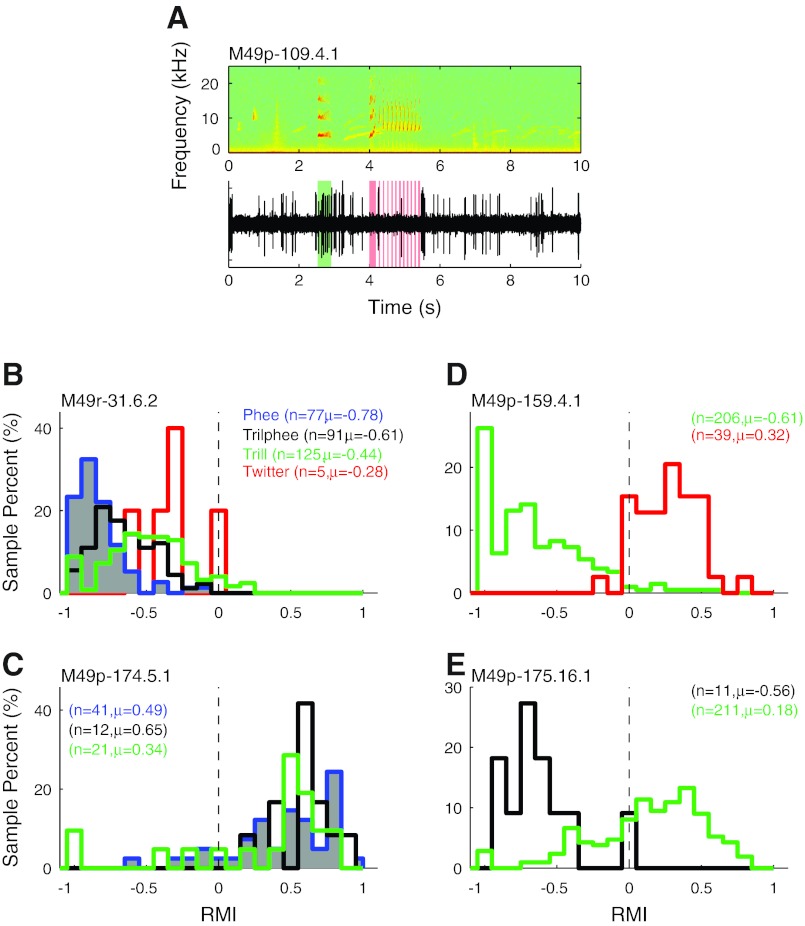
Fig. 11.
Samples of individual units' responses to multiple call types. When multiple call types were vocalized while recording from stable single units, the responses were compared between the different vocalizations. A: sample spectrogram (top) and raw neural trace (bottom) of a unit sampled while the animal made a trill (green) and a twitter (red) in rapid succession. This unit was suppressed during the twitter but seemed to be excited by the preceding trill. B and C: vocal RMI distributions are shown for 2 units both of which showed consistent responses to the multiple call types, one consistently suppressed (B) and one consistently excited (C). N is the number of vocalizations of each call type, and the corresponding mean RMI is indicated. In contrast, some units like the sample in A exhibited opposite responses during different call types, as illustrated in D and E.

