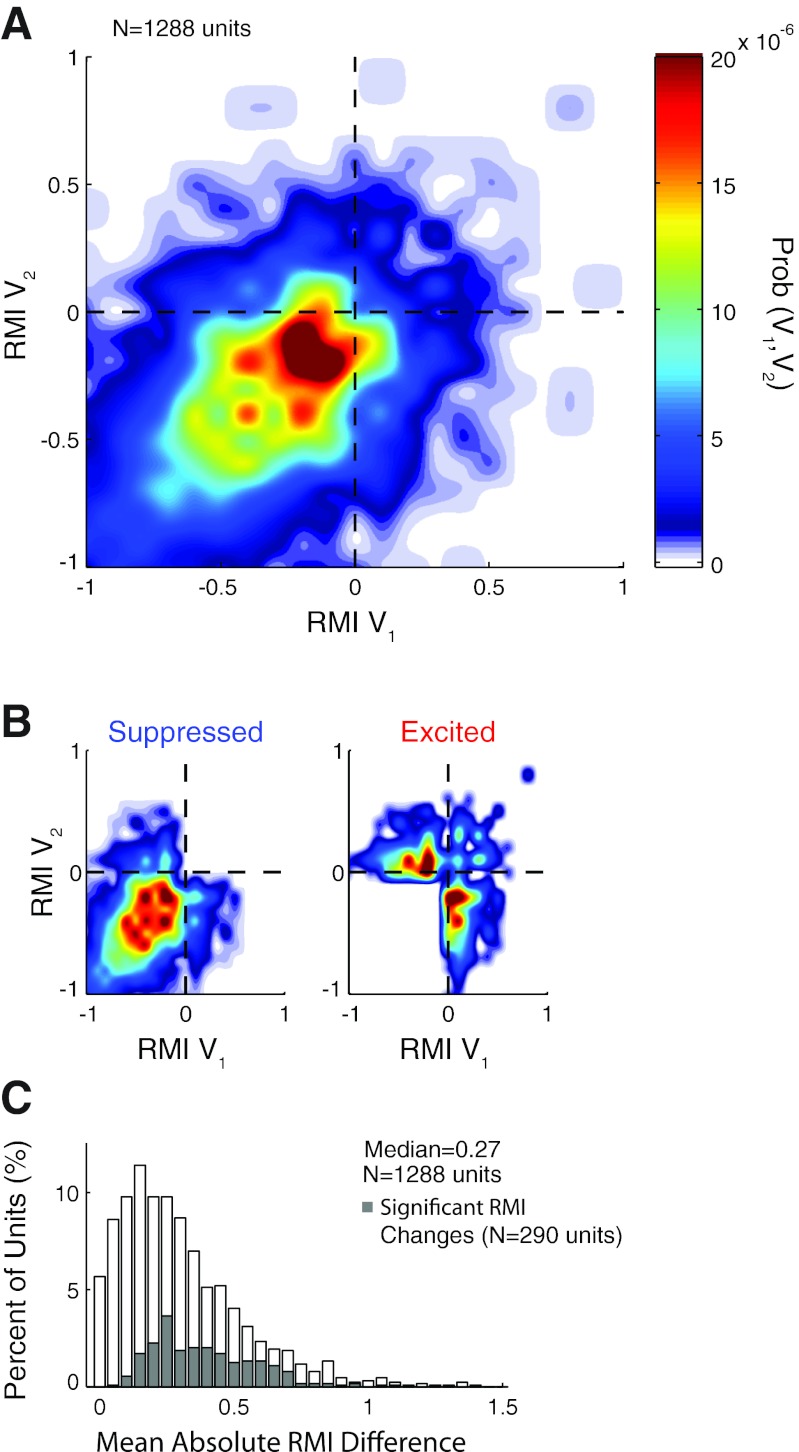
Fig. 12.
Comparison of call type differences within individual units across the population. A: a joint probability function is plotted comparing RMIs between pairs of call types (V1, V2). The highest density was for units weakly suppressed by both vocalizations. Overall, units suppressed by both call types, the bottom left quadrant, were most prevalent (66.4% of units). Units excited by both vocalizations (top right) accounted for 6.0% of units. Units switching behavior, those in the remaining 2 quadrants, account for 27.6% of units. B: probability functions are shown separately plotting the behavior of units suppressed (RMI < 0, left) or excited (RMI > 0, right) for at least 1 call type. The probability scale is the same as for A. Suppressed neurons were more likely to remain suppressed, while excited units were more likely to change behavior. Those units whose RMI changed were clustered near the zero RMI line for 1 call type, indicating that their vocal responses generally changed from suppressed or excited to unresponsive. C: a population distribution shows the distribution of RMI differences between call type pairs for individual units. Units whose RMI changed significantly (P < 0.05, Kruskal-Wallis) are shaded.

