Fig. 2.
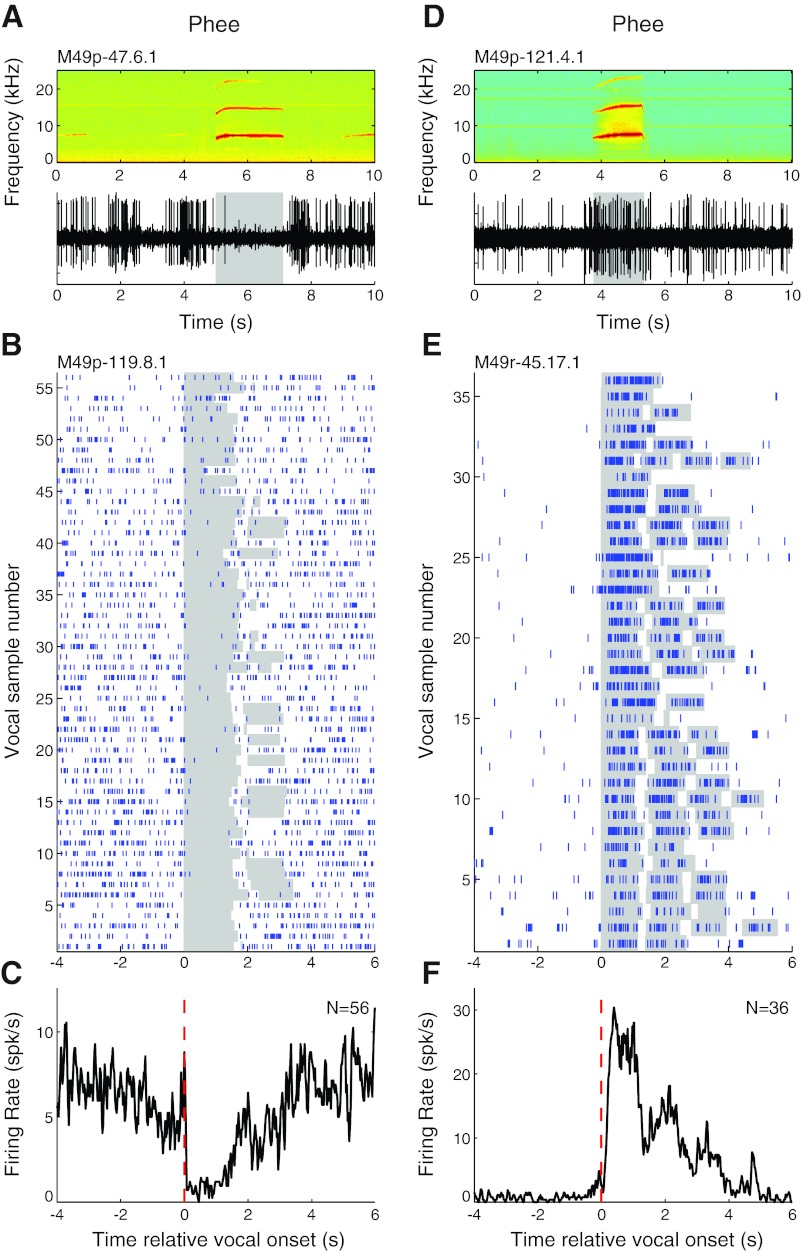
Sample vocalization-related neural activity during phee calls. Examples are shown for units that were suppressed (A–C) and excited (D–F) during phees. A: simultaneously recorded vocal spectrogram (top) and extracellular neural recording trace (bottom) for a unit that exhibited vocalization-related suppression during phee vocalizations. Duration of vocalization is indicated by shaded box. B: raster plot for another example unit that was suppressed during a large number of phee vocalizations. Individual vocalization responses have been aligned by vocal onset for convenience (shaded). C: peristimulus time histogram (PSTH) of phee vocalization responses illustrated in B. Vocal onset is indicated by dashed red line. D: neural recording trace of a unit that exhibited vocalization-related excitation during phees. E and F: rasters (E) and a PSTH (F) for another example unit that was strongly excited by phee vocalizations.

