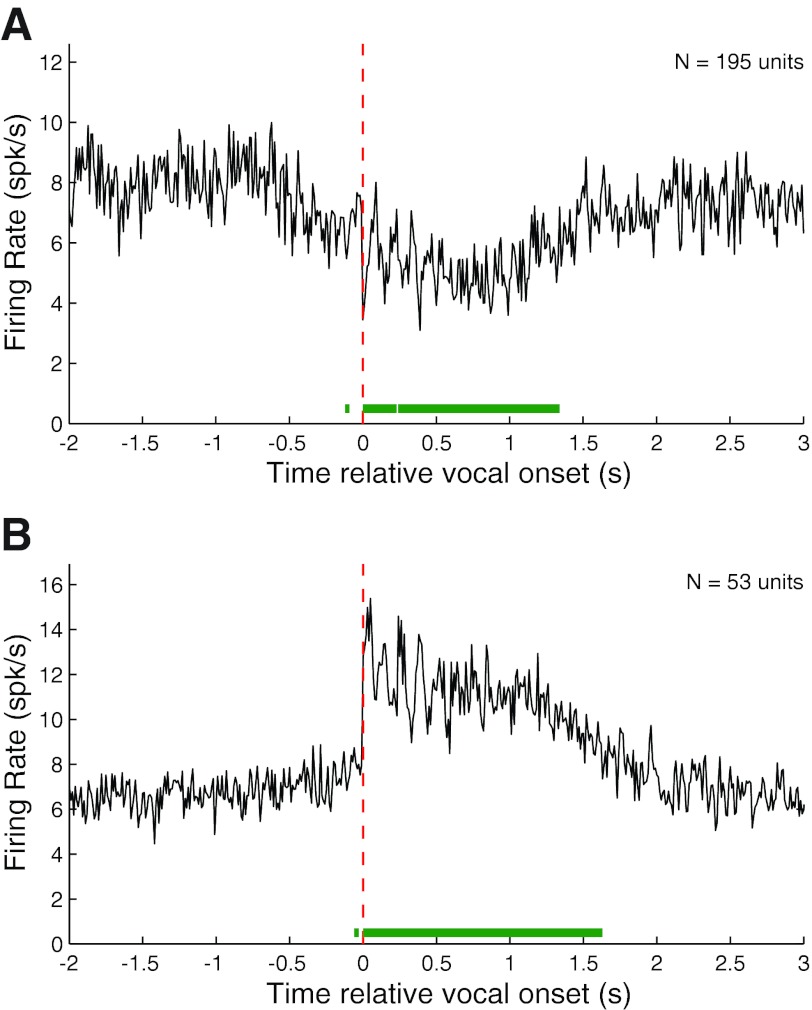
Fig. 9.
Population average PSTHs for suppressed and excited responses during twitter vocalizations. A: population average PSTH for suppressed twitter responses (RMI ≤ −0.2) showing a large decrease in firing rate during vocalization. The PSTH suggests prevocal suppression, but this was not statistically significant. B: population average PSTH for excited responses (RMI ≥ 0.2). Both suppressed and excited PSTHs show oscillations shortly after vocal onset that are suggestive of phasic responses related to the twitter vocalization phrases (see Fig 1D). This phasic response is not optimally reflected by an onset-aligned PSTH because of variability in phrase durations.

