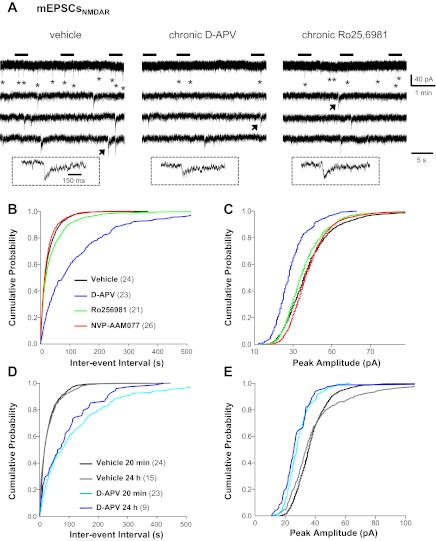
Fig. 4.
NMDAR-mediated mEPSCs (mEPSCNMDAR) in granule cells were dramatically reduced in d-APV- and Ro25-6981-treated hippocampal slice cultures. Recordings were conducted at a −45-mV holding potential in 0 mM Mg2+ recording buffer containing TTX (1 μM), BMI (10 μM), and 2,3-dioxo-6-nitro-1,2,3,4-tetrahydrobenzo[f]quinoxaline-7-sulfonamide disodium salt (NBQX; 10 μM). A holding potential of −45 mV was chosen over −70 mV because 0 mM Mg2+ recording buffer caused very large increases in baseline noise at −70 mV (see Fig. 6A), which made mEPSCNMDAR extremely difficult to detect and analyze. Cumulative probability plots were generated from events pooled from all cells and included 1,456 mEPSCNMDAR for vehicle, 272 for chronic d-APV, 723 for chronic Ro25-6981, and 1,456 for chronic NVP-AAM077. A: representative mEPSCNMDAR (*) recorded in granule cells from cultures treated chronically with vehicle (left), d-APV (middle), or Ro25-6981 (right). The 3 lower traces are expanded time scales of the periods marked by horizontal bars above the top trace. Traces in insets are an expanded time scale of the mEPSCNMDAR marked with an arrow. Cumulative probability plots show that mEPSCNMDAR frequency (B) and amplitude (C) were dramatically reduced in granule cells from d-APV-treated cultures; smaller decreases in frequency are shown for Ro25-6981. When d-APV was removed from the culture medium 24 h before recordings, the chronic d-APV-induced decreases in mEPSCNMDAR frequency (D) and amplitude (E) persisted. Vertical scale bar in A, top right, applies to all traces in A. Horizontal scale bar in A, top right, applies to all top traces in A; that in A, bottom right, to all lower traces in A; and that in A, left inset, to all traces in insets. Legend in B applies to B and C, and that in D applies to D and E; the number of granule cells/slice cultures is indicated in parentheses. See Table 1 for means.

