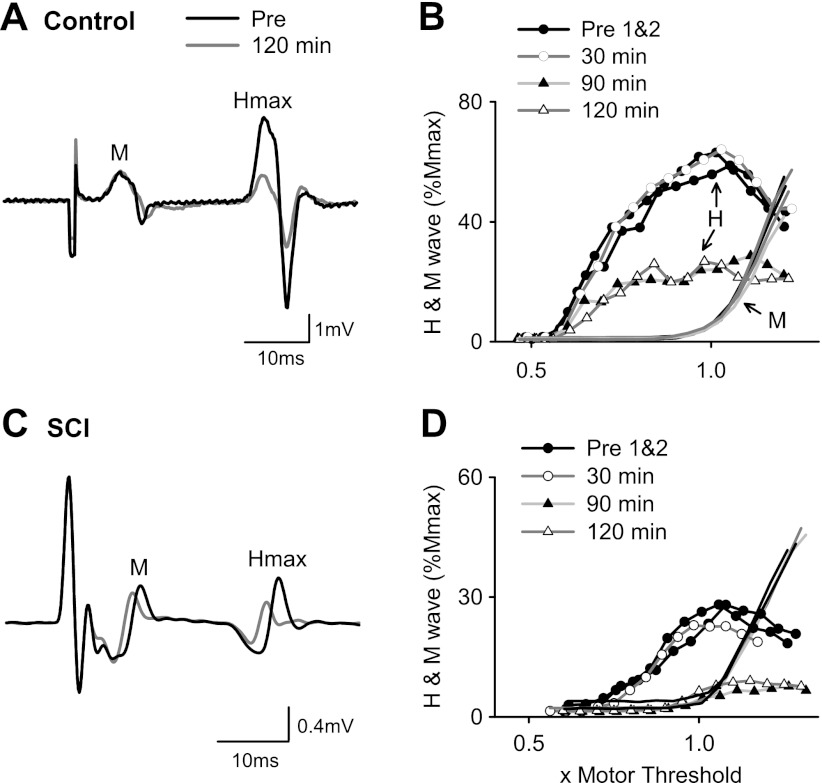
Fig. 1.
H-reflexes after zolmitriptan in uninjured control and spinal cord-injured (SCI) participants. A: M-wave (M) and maximum H-reflex (Hmax) recorded in a single uninjured control participant before (black trace) and 120 min after (gray trace) 10 mg of zolmitriptan. B: corresponding H-reflex and M-wave recruitment curve from same participant in A plotted peak to peak and normalized to Mmax. Stimulation intensity is expressed as a multiple of motor threshold. The 2 predrug H-wave recruitment curves (Pre1&2) are represented by black lines and solid circles, the 30-min curve by a dark gray line and open circles, the 90-min curve by a light gray line and solid triangles, and the 120 min curve by a dark gray line and open triangles (data at 60 min not shown for clarity). M-wave recruitment curves have similar line colors but with no symbols for clarity. C and D: similar to A and B but for a T3–T4 SCI participant (subject 2M in Table 1).

