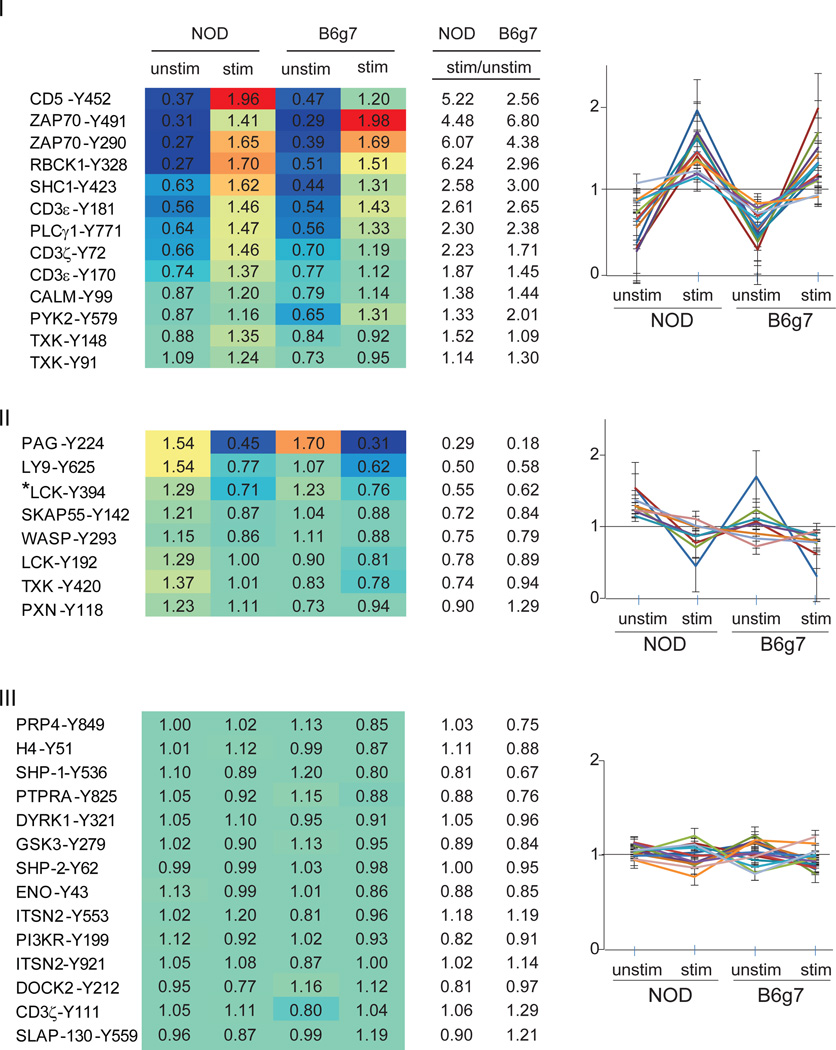
Figure 2.
Heatmap and graphical clustering analysis of phosphotyrosine sites in unstimulated and stimulated CD4+ T cells from NOD and B6g7 mice. Clusters were classified into three major different categories: I. increased phosphorylation, II. decreased phosphorylation in both NOD and B6g7 upon treatment with anti-CD3 antibody, and III. peptides with minimal change during activation. Values in the table are normalized row-wise by the mean of all four conditions (unstimulated, stimulated; NOD and B6g7 mice) for each of the peptide. Heatmap color graduation varies from low (blue) to high (red) tyrosine phosphorylation. * The tryptic peptide containing pY394 could not be unambiguously assigned to LCK, SRC, FYN or YES because its sequence is identical among these Src kinase family members.

