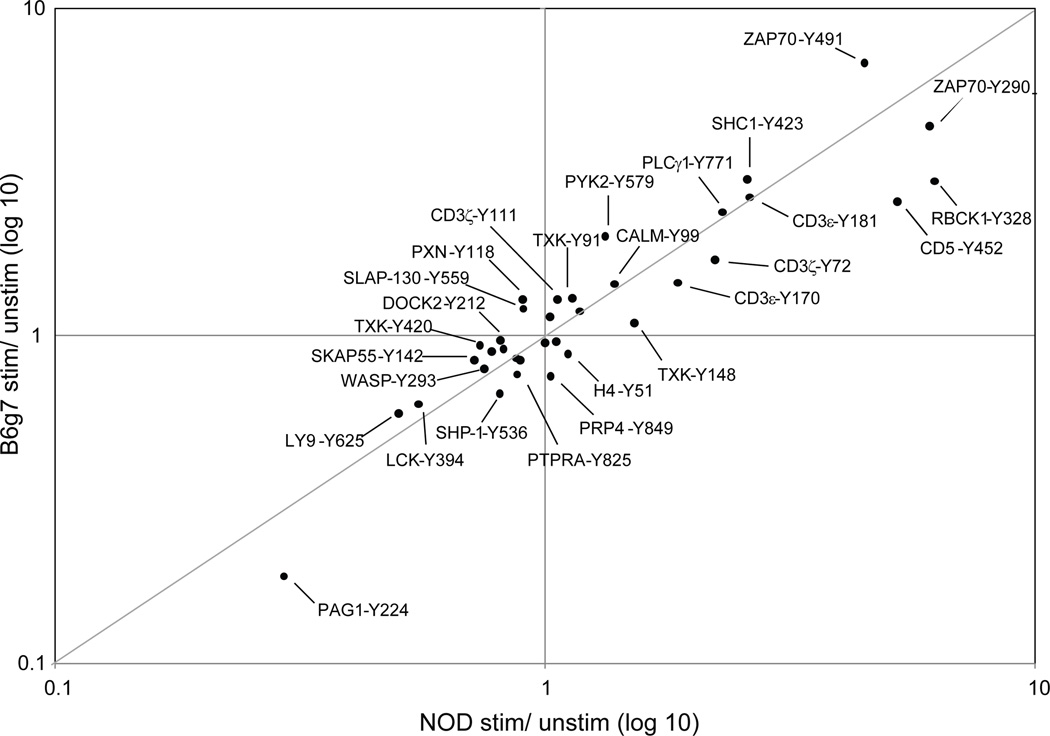
Figure 3.
Quantification of tyrosine phosphorylation in B6g7 and NOD CD4+ T cells stimulated with anti-CD3 for 5 minutes. For each phosphorylated peptide, fold-change phosphorylation level was calculated for stimulated to unstimulated CD4+ T cells. Fold-change for B6g7 cells was then compared to fold-change for NOD cells to obtain the plot.

